Read this to the class:
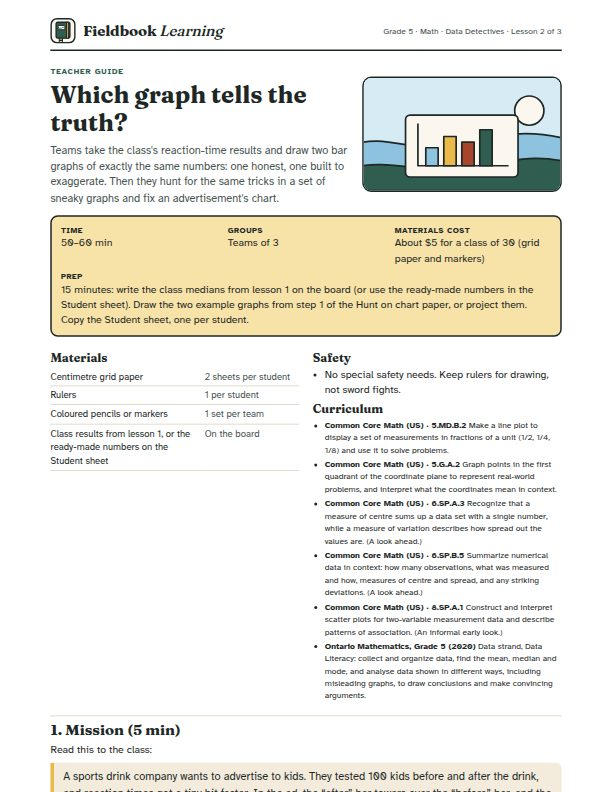
A sports drink company wants to advertise to kids. They tested 100 kids before and after the drink, and reaction times got a tiny bit faster. In the ad, the "after" bar towers over the "before" bar, and the headline says "DOUBLE YOUR SPEED!" The numbers in the ad are real. Something about the picture isn't. Your team's job: learn how a graph can tell a fib with true numbers, and learn how to draw one that tells the truth.
Teams of three, with three jobs that rotate between graphs: Scale-setter (plans the axis), Drawer (draws the bars), Checker (checks every number against the data).
In the full lesson PDF
- Bet (5–10 min)
- Hunt (20 min)
- Reveal (10–15 min)
- Act (10 min)
- Background for the teacher
- Assessment
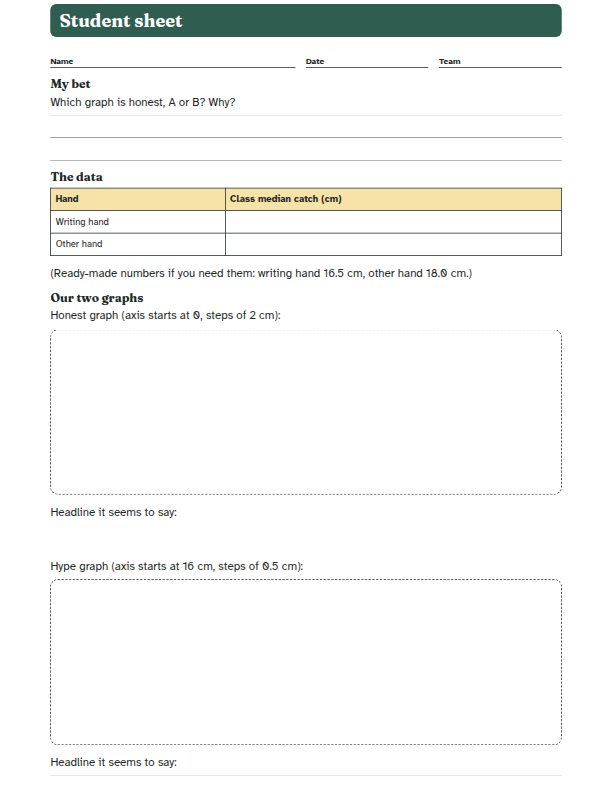
- Student sheet
US Letter, prints cleanly in black and white. The student sheet is on its own page, ready to photocopy.