Grade 3 Common Core Math: Data and Graphs
Twenty-two printable pages for Grade 3 data: sorting with Venn, Carroll and tree diagrams, collecting data into frequency tables, pictographs and bar graphs with scales of 2, 5 and 10, the mean and the mode, and probability words. Includes two pages of real 2026 NOAA snowfall data, a class data investigation, an end-of-unit assessment and a worked answer key. Only the scaled graphs are a Grade 3 standard (3.MD.B.3); the mean, mode and probability pages go beyond Grade 3.
22 printable pages · teacher notes and answer key · United States (Common Core)
This pack isn't on your account yet. Buy it below, or sign in with the email you bought it with.
Editable student pages (Word): change the wording, add lines or cut a question. Opens in Word or Google Docs.
Yours to keep, with free updates. Pay by card in US dollars.
Included in every school licence: one purchase order covers every pack for your whole staff.
Already bought it? Download the PDF (sign in with the email you bought it with).
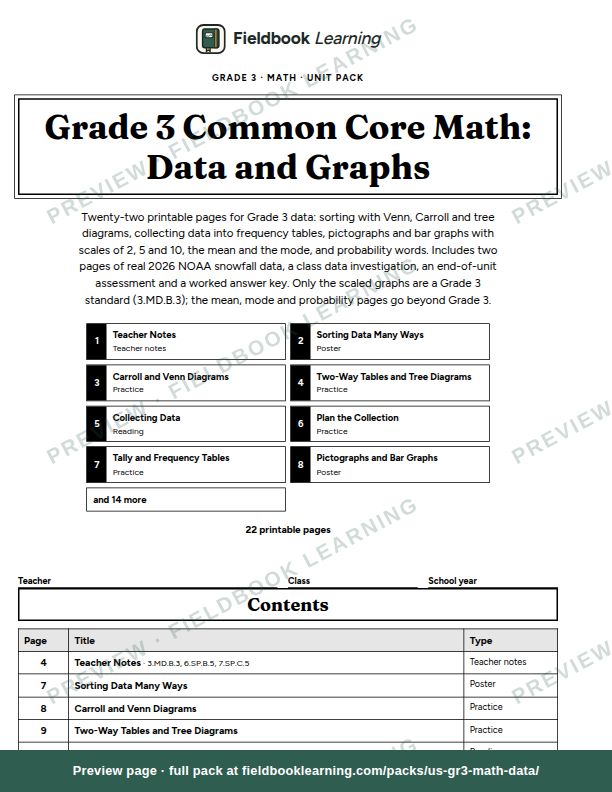
Grade 3 Common Core Math: Data and Graphs gives students everything they need to organize, graph and read data, in the order a teacher would teach it. Students sort buttons and survey answers by two and three attributes in two-way tables, Venn diagrams, Carroll diagrams and tree diagrams. They plan questions, collect data by watching, testing and asking, and turn tallies into frequency tables. Then they draw pictographs with a key and bar graphs with scales of 2, 5 and 10, each with a title, labels and a source, and read graphs at three levels: reading off a value, comparing, and making a decision.
The mean is taught by leveling out towers of cubes until every tower is the same height, before students add and share. Two pages use real snowfall data from NOAA for January to May 2026: students graph the snowy days in Duluth, Minnesota, then compare Burlington, Vermont, with Portland, Maine, using the mean and the mode. Probability pages use the five likelihood words to predict, test with a bag of tiles, and decide, and a class activity asks whether another Grade 3 class will have the same mean and mode as ours. A two-page class data investigation takes students from their own question to a graph they present.
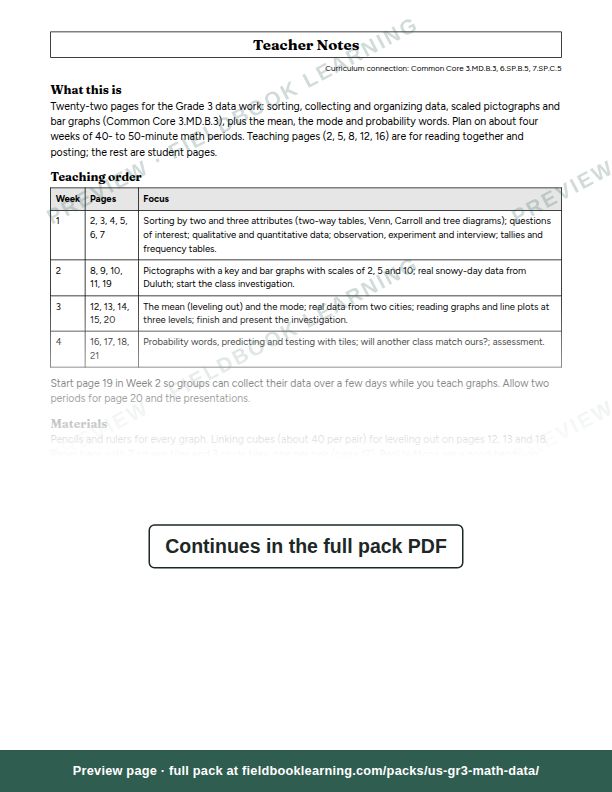
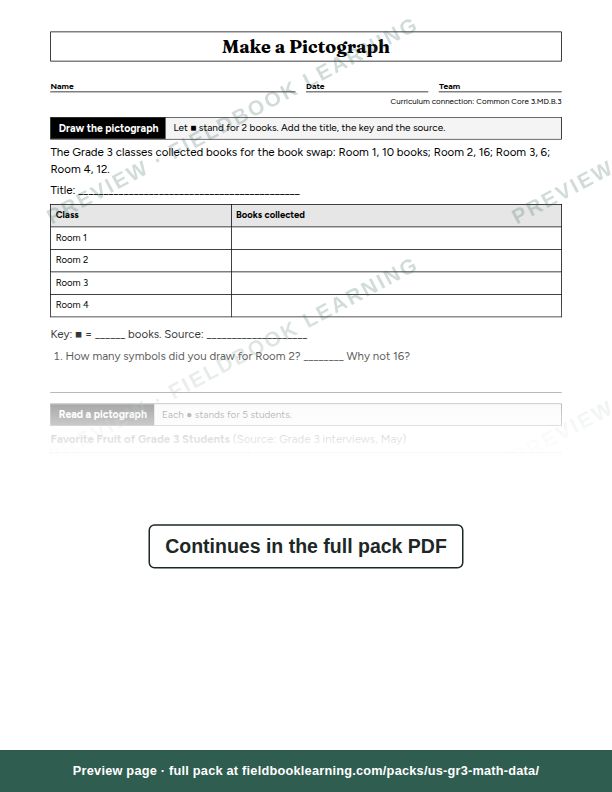
Inside: teacher notes with a teaching order over about four weeks, timing, materials, differentiation, the common misconceptions and a map from standard to pages; five teaching pages with worked examples; ten practice pages; four activities; an end-of-unit assessment; and an answer key with every answer worked out and checked. The scaled-graph pages line up with Common Core 3.MD.B.3; the mean, mode and probability pages go a little beyond Grade 3, and the notes say where to skip them. Everything is black and white and nothing depends on color. The free sample is the teacher notes and the pictograph practice page.
Sample pages
What's inside
- 01Teacher NotesTeacher notes
- 02Sorting Data Many WaysPoster
- 03Carroll and Venn DiagramsPractice
- 04Two-Way Tables and Tree DiagramsPractice
- 05Collecting DataReading
- 06Plan the CollectionPractice
- 07Tally and Frequency TablesPractice
- 08Pictographs and Bar GraphsPoster
- 09Make a PictographPractice
- 10Make a Bar GraphPractice
- 11Real Data: Snowy Days in DuluthPractice
- 12The Mean and the ModePoster
- 13Level It Out: Mean and ModePractice
- 14Real Data: Two Snowy CitiesPractice
- 15Read the Graph, Make a DecisionPractice
- 16How Likely Is It?Poster
- 17Predict and TestActivity
- 18Will Another Class Match Ours?Activity
- 19Class Data Investigation: Plan and CollectActivity
- 20Class Data Investigation: Show and ShareActivity
- 21End-of-Unit Assessment: DataAssessment
- 22Answer KeyAnswer key