Grade 4 Common Core Math: Data and Graphs
Twenty-two printable pages on collecting, organizing and graphing data, with real NOAA weather data: scaled bar graphs (Grade 3, 3.MD.B.3) and statistics and probability pages that go beyond Grade 4 (mean, median, mode and statistical questions are Grade 6, the probability line is Grade 7). It does not cover Grade 4 line plots with fractions (4.MD.B.4). Answer key and assessment included.
22 printable pages · teacher notes and answer key · United States (Common Core)
This pack isn't on your account yet. Buy it below, or sign in with the email you bought it with.
Editable student pages (Word): change the wording, add lines or cut a question. Opens in Word or Google Docs.
Yours to keep, with free updates. Pay by card in US dollars.
Included in every school licence: one purchase order covers every pack for your whole staff.
Already bought it? Download the PDF (sign in with the email you bought it with).
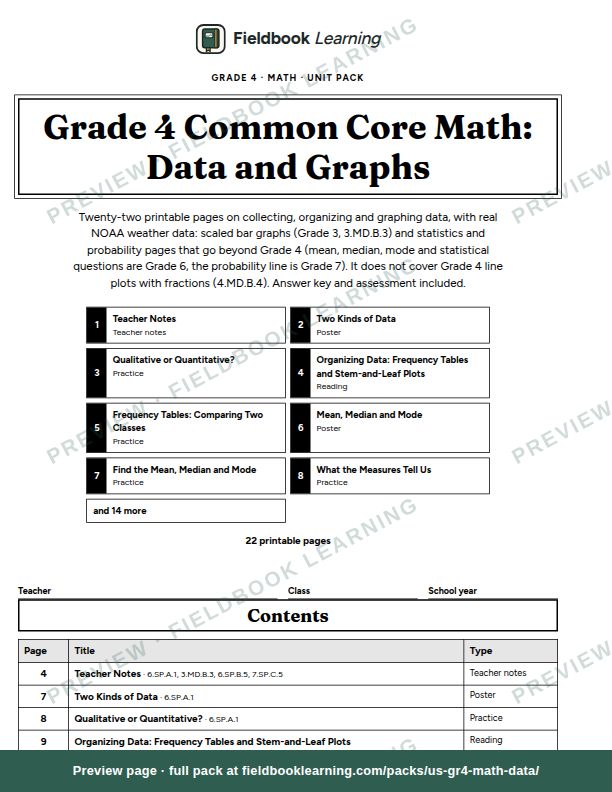
Grade 4 Math: Data is a printable unit on collecting, organizing, graphing and describing data, built around Common Core 3.MD.B.3 (scaled bar graphs, a Grade 3 standard) with statistics and probability pages that stretch beyond Grade 4 (6.SP.A.1, 6.SP.B.5, 7.SP.C.5). It does not cover the one Grade 4 data standard, 4.MD.B.4 (line plots with fractions of a unit); line plots appear only as a graph choice on pages 11 and 12. Students sort questions into qualitative and quantitative, collect data from people and from U.S. government sources, and organize it in frequency tables and stem-and-leaf plots. They choose between pictographs, line plots, bar graphs and multiple-bar graphs, draw them on blank grids with a title, labels, a scale and a source, and read graphs at three levels: reading off a value, comparing, and arguing a conclusion. Then they find the mean, median and mode, explain what each one says, and place events on a probability line.
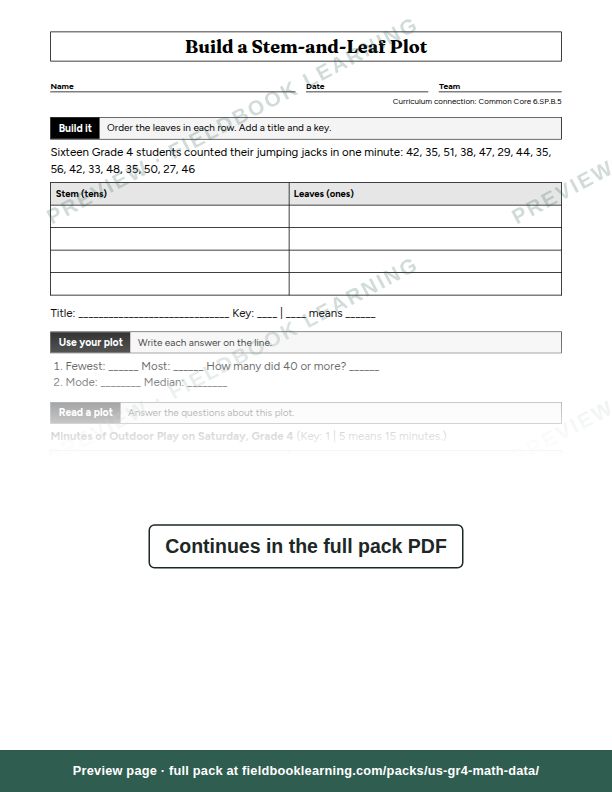
Two pages use real weather data from NOAA’s Applied Climate Information System: Philadelphia’s daily high temperatures for June 2026 become a stem-and-leaf plot with two modes, and six months of rain and snow in Atlanta and Seattle become a multiple-bar graph that surprises anyone who thinks Seattle is always the wetter city. A two-page class data investigation takes students from their own question to an infographic they present, and a probability page has the class predict whether another class’s mean, median and mode will match its own, then test it.
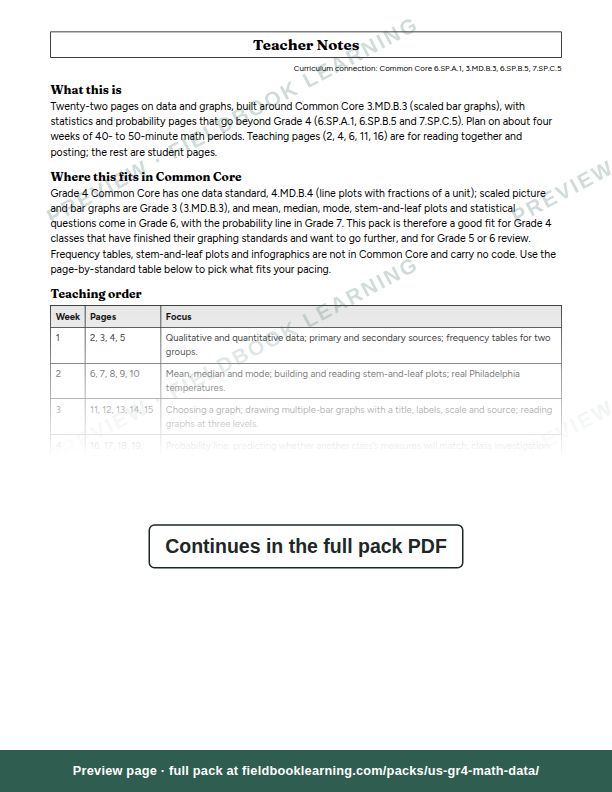
Inside: teacher notes with a teaching order over about four weeks, timing, materials, differentiation, the common misconceptions for each topic and a map from Common Core standard to pages; five teaching pages with worked examples; eleven practice pages; three activities; an end-of-strand assessment; and an answer key with every answer worked out. Everything is in black and white and nothing depends on color. The free sample is the teacher notes and the stem-and-leaf practice page.
Sample pages
What's inside
- 01Teacher NotesTeacher notes
- 02Two Kinds of DataPoster
- 03Qualitative or Quantitative?Practice
- 04Organizing Data: Frequency Tables and Stem-and-Leaf PlotsReading
- 05Frequency Tables: Comparing Two ClassesPractice
- 06Mean, Median and ModePoster
- 07Find the Mean, Median and ModePractice
- 08What the Measures Tell UsPractice
- 09Build a Stem-and-Leaf PlotPractice
- 10Real Data: Philadelphia's June HighsPractice
- 11Choosing the Right GraphPoster
- 12Which Graph Fits?Practice
- 13Draw a Multiple-Bar GraphPractice
- 14Real Data: Rain in Atlanta and SeattlePractice
- 15Read the Graph, Make the CasePractice
- 16The Probability LinePoster
- 17How Likely Is It?Practice
- 18Will Another Class Match Ours?Activity
- 19Class Data Investigation: Plan and CollectActivity
- 20Class Data Investigation: Make an InfographicActivity
- 21End-of-Strand Assessment: DataAssessment
- 22Answer KeyAnswer key