Grade 5 Common Core Math: Data and Graphs
Sampling, relative-frequency tables, stacked-bar graphs, mean, median and mode with decimals, and probability as a fraction, with real NOAA weather data. 22 printable pages for Grade 5 classes ready to go further: the Common Core teaches most of this in Grades 6 and 7, so use it as enrichment, a review or for a mixed-grade class. Teacher notes and a fully worked answer key included.
22 printable pages · teacher notes and answer key · United States (Common Core)
This pack isn't on your account yet. Buy it below, or sign in with the email you bought it with.
Editable student pages (Word): change the wording, add lines or cut a question. Opens in Word or Google Docs.
Yours to keep, with free updates. Pay by card in US dollars.
Included in every school licence: one purchase order covers every pack for your whole staff.
Already bought it? Download the PDF (sign in with the email you bought it with).
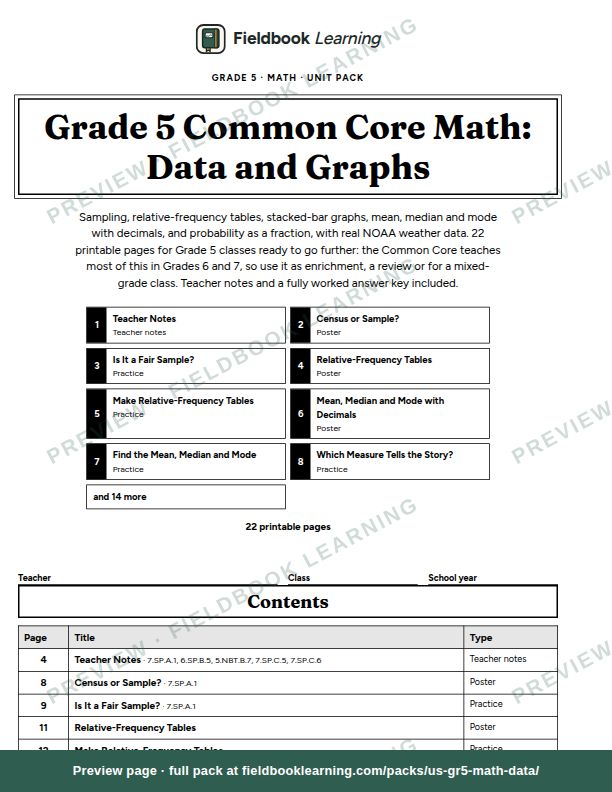
Grade 5 Common Core Math: Data and Graphs gives students a four-week run through data and probability. Students learn the difference between a census and a sample, and choose samples with simple random, stratified random and systematic random sampling. They turn frequencies into relative-frequency tables with fractions, decimals and percents, build stacked-bar graphs so groups of different sizes can be compared fairly, catch misleading graphs that don’t start at zero, and find the mean, median and mode of decimal data. In probability they write probabilities as fractions on a 0-to-1 probability line and compare theoretical and experimental results.
Two pages use real weather data from NOAA’s Regional Climate Centers (ACIS), exactly as published: ten September 2026 daily highs in Boston and Phoenix give decimal data for the mean, median and mode, and ten days of rain records for Seattle, Phoenix, Des Moines and Miami become a stacked-bar graph that challenges the idea that Seattle is always the rainiest city. A two-page class investigation takes students from a sampling plan to an infographic they present.
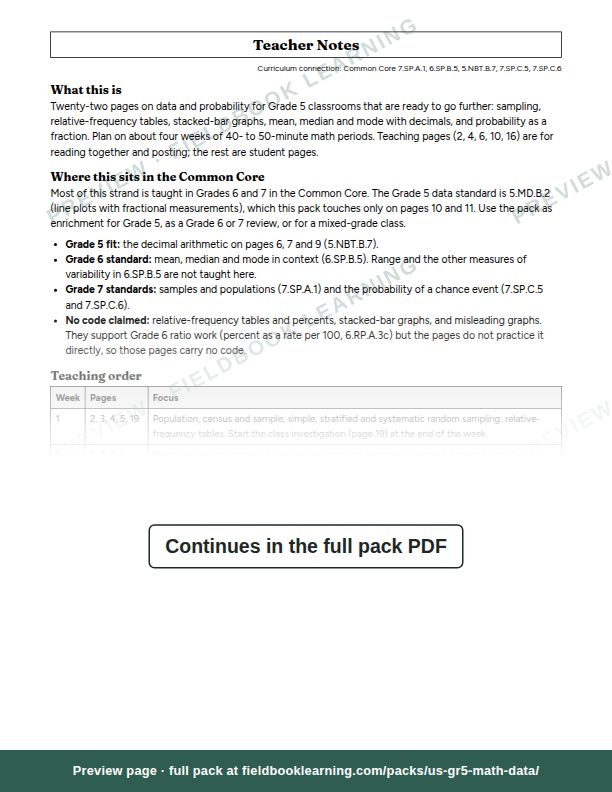
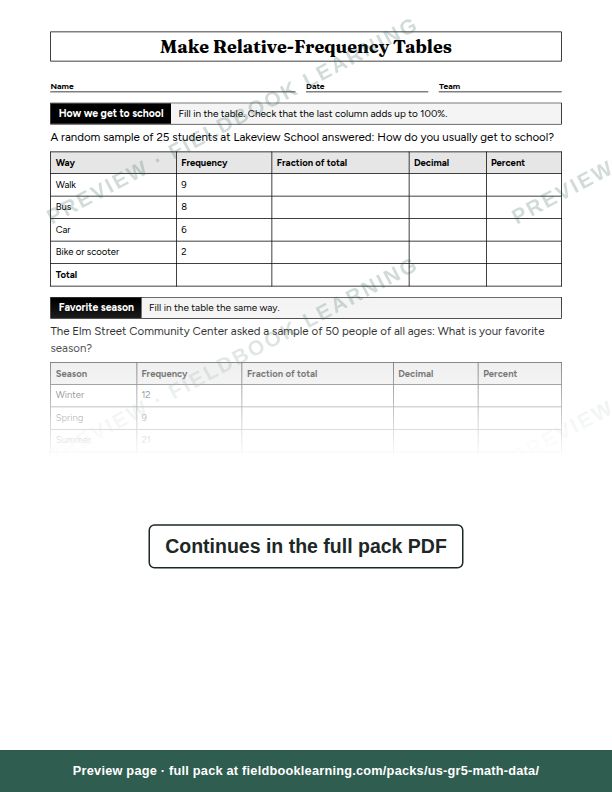
Inside: teacher notes with a four-week teaching order, timing, materials, differentiation, the common misconceptions and a map from each Common Core standard to the pages; five teaching pages with worked examples; eleven practice pages; three activities; an end-of-strand assessment; and an answer key with every answer worked out and checked a second way. Most of this strand is taught in Grades 6 and 7 in the Common Core, so the teacher notes say which pages fit which grade: use it as Grade 5 enrichment, a Grade 6 or 7 review, or for a mixed-grade class. Everything is in black and white and nothing depends on color. The free sample is the teacher notes and the relative-frequency practice page.
Sample pages
What's inside
- 01Teacher NotesTeacher notes
- 02Census or Sample?Poster
- 03Is It a Fair Sample?Practice
- 04Relative-Frequency TablesPoster
- 05Make Relative-Frequency TablesPractice
- 06Mean, Median and Mode with DecimalsPoster
- 07Find the Mean, Median and ModePractice
- 08Which Measure Tells the Story?Practice
- 09Real U.S. Data: September HighsPractice
- 10Choosing a GraphPoster
- 11Which Graph Fits?Practice
- 12Draw a Stacked-Bar GraphPractice
- 13Real U.S. Data: Wet and Dry DaysPractice
- 14Spot the Misleading GraphPractice
- 15Read the Graph, Make the CasePractice
- 16Probability as a FractionPoster
- 17Fractions on the Probability LinePractice
- 18Theory or Experiment?Activity
- 19Class Data Investigation: Sample and CollectActivity
- 20Class Data Investigation: Make an InfographicActivity
- 21End-of-Strand Assessment: DataAssessment
- 22Answer KeyAnswer key