Years 7–8 in England and Wales · Cambridge Lower Secondary Stages 7–8 · IB MYP 1 to MYP 2, ages 11–13
Is It Fair? Chance and Probability
Is a six harder to roll? Which bag gives the best chance of a red? Why does horse 7 always win? Can you design a fair game? Four lessons with dice, coins, counters and spinners where students test their hunches and find out what chance really does.
Or try any 3 lessons free with an account. Prices in US dollars.
Already bought it? Download the whole unit as one printable workbook (58 pages): cover, contents, curriculum connections, every lesson, readings, practice pages, a unit test and an answer key, in black and white. Want to change the wording? Get every student page as one editable Word file.
4 lessons in this unit
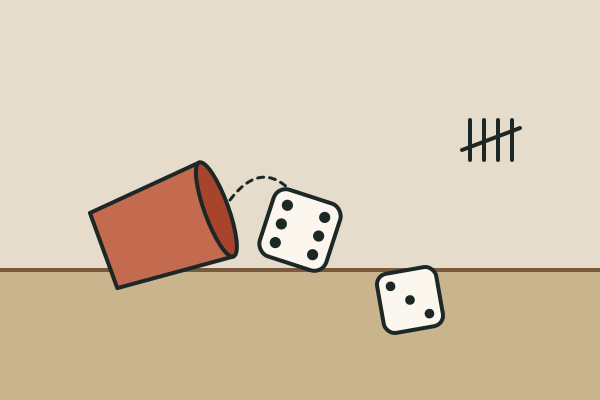 Lesson 1 · 50–60 min · 7 pagesIs a six harder to roll?Teams roll a die 30 times and get lopsided results, then pool the whole class's rolls and watch every face settle close to one-sixth. Students place events on a probability scale from 0 to 1, write probabilities as fractions, decimals and percents, and explain why experimental probability gets closer to theoretical probability with more trials.
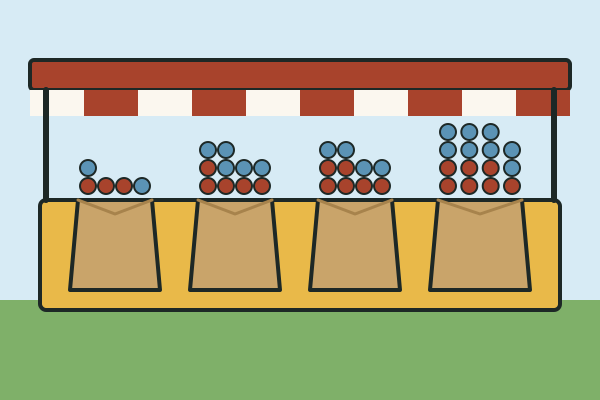 Lesson 2 · 50–60 min · 8 pagesWhich bag would you pick from?To win a prize you must pull a red counter from one of four bags. Teams find that the bag with the most red counters gives the worst chance, and that two bags with different numbers of counters give exactly the same chance. Students find and compare probabilities, use the complement, and test their predictions by drawing with replacement.
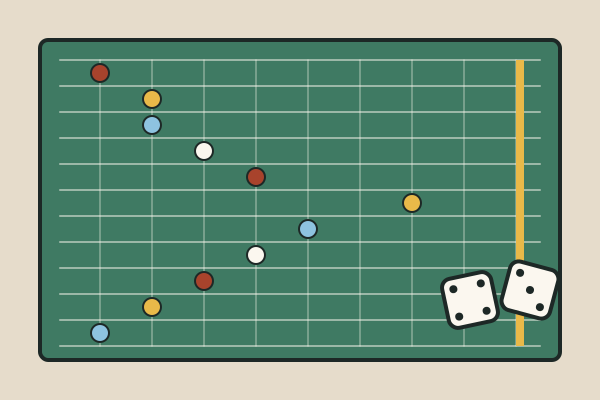 Lesson 3 · 50–60 min · 8 pagesWhy does horse 7 always win?Teams play a horse race where horses numbered 2 to 12 move when the sum of two dice matches their number. Horse 7 wins again and again, and horse 2 and horse 12 hardly move. Students build the 36-outcome sample space in a table, find probabilities of compound events, and explain why sums in the middle are more likely.
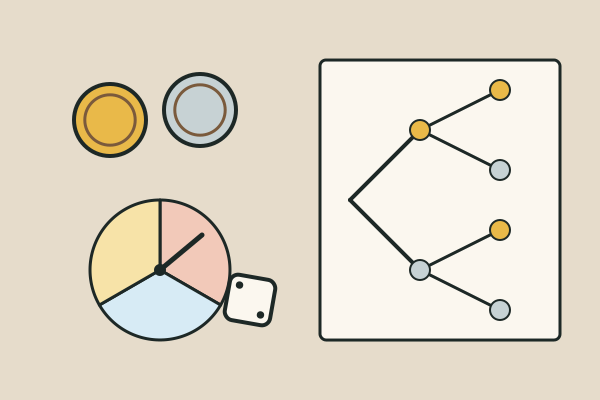 Lesson 4 · 50–60 min · 9 pagesCan you design a fair game?Teams test three two-player games with coins, dice and spinners, and find that a game that sounds fair, odd or even products of two dice, gives one player three times the chance of the other. Using tree diagrams and tables, students find the probability of each player winning, then design, test and defend a fair game of their own.
Materials for the whole unit · one list, lesson by lesson
Lesson 1: Is a six harder to roll?
- Six-sided die1 per team
- Paper cup or shallow tray to roll into1 per team
About $5 for a class set of dice if you have none
Lesson 2: Which bag would you pick from?
- Counters or paper squares, red and blue, that feel the same21 red and 19 blue per set of four bags
- Paper bags or envelopes4 per set
Free with counters or cut paper squares in two colours
Lesson 3: Why does horse 7 always win?
- Six-sided dice2 per team
- Race track (from the Worksheet) and 11 small markers1 track and 11 markers per team
- Paper cup or tray to roll into1 per team
About $5 for dice if you have none
Lesson 4: Can you design a fair game?
- Coins2 per team
- Six-sided dice2 per team
- Paper clip and pencil (for the paper-clip spinner)1 each per team
- Paper cup or tray to roll into1 per team
Free with coins and dice you already have
Students begin by rolling a die 30 times, getting lopsided results, and watching the whole class’s 300 rolls settle close to one-sixth for every face: the difference between experimental and theoretical probability, and why sample size matters. At a fair stall with four bags of counters, the bag with the most red counters turns out to give the worst chance, because probability compares a part with the whole. A horse race on the sums of two dice shows why horse 7 nearly always wins, through the 36-outcome sample space. Finally, teams test three games that all sound fair, find that “odd or even product” gives one player three times the chance of the other, and design and defend a fair game of their own.
By the end of the unit, students can place events on a probability scale from 0 to 1, write probabilities as fractions, decimals and percents, find theoretical and experimental probabilities and explain why they differ, use the complement, build sample spaces for compound events with tables and tree diagrams, and judge whether a game is fair. Everything uses dice, coins, counters, paper bags and a paper-clip spinner.