Years 7–9 in England and Wales · Cambridge Lower Secondary Stages 7–9 · IB MYP 1 to MYP 3, ages 11–14
Natural Selection: How Living Things Change Over Time
A peppered moth hunting game over four generations, the Grants' real Galápagos finch data from the 1977 drought, whale fossils in rock-layer order with a forelimb bone comparison, and five case stations on selective breeding and antibiotic resistance. Every lesson runs on printed sheets alone: no materials to buy.
Or try any 3 lessons free with an account. Prices in US dollars.
Already bought it? Download the whole unit as one printable workbook (77 pages): cover, contents, curriculum connections, every lesson, readings, practice pages, a unit test and an answer key, in black and white. Want to change the wording? Get every student page as one editable Word file.
4 lessons in this unit
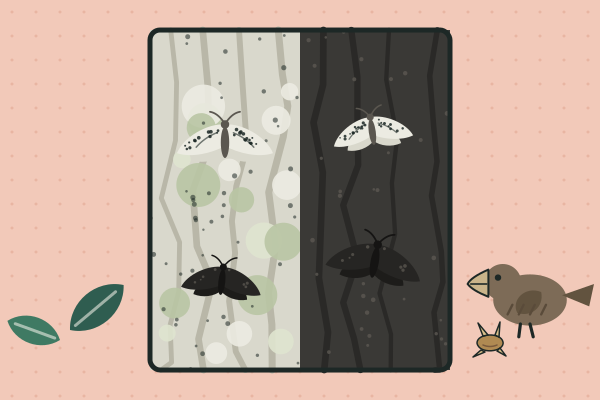
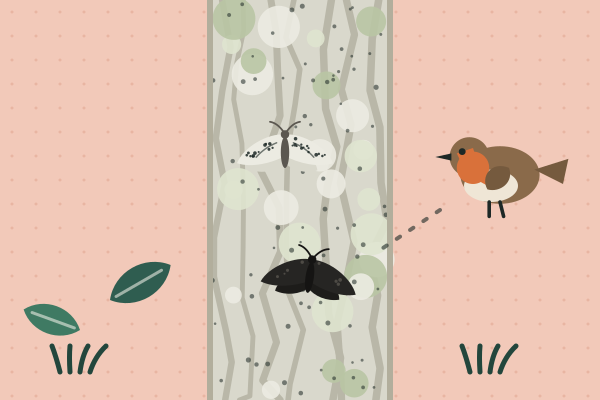 Lesson 1 · 50–60 min · 14 pagesWhy do some animals survive and others don't?Teams play hungry birds hunting printed light and dark peppered moths on printed clean and sooty bark, over four generations, and graph how the moth population changes. Then they explain the real peppered moth story: variation, survival and reproduction, not moths trying to change.
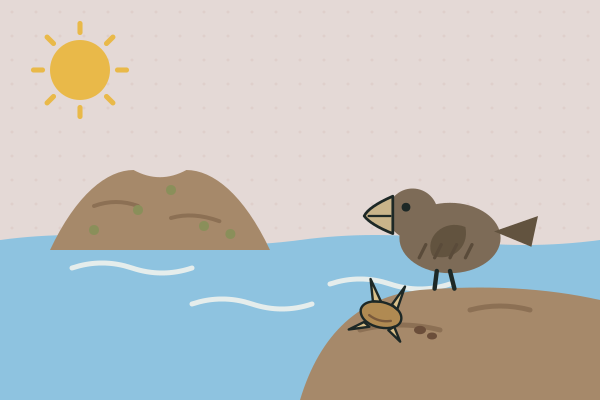 Lesson 2 · 50–60 min · 10 pagesWhat did the Grants find on the Galápagos?Teams play out a drought on a Galápagos island with printed finch and seed cards, then graph the real data Peter and Rosemary Grant collected when a drought in 1977 killed most of the medium ground finches. Students calculate how much the average beak changed and explain why.
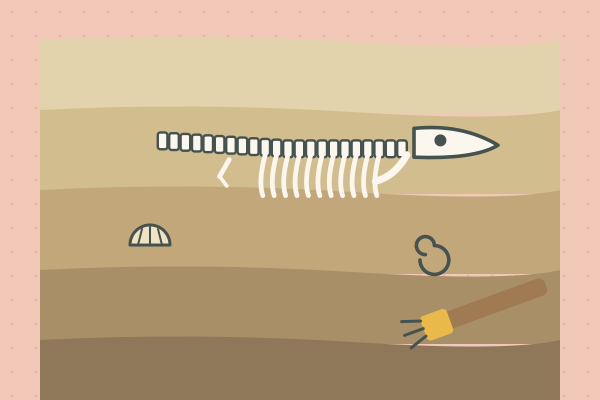 Lesson 3 · 50–60 min · 10 pagesHow do fossils show life has changed?Teams build a rock column from printed fossil cards of early whales, from a four-legged land animal to a sea creature with tiny hind legs, and track the changes. Then they compare the bones in a human arm, a cat's leg, a whale's flipper, a bat's wing and a bird's wing, and explain what the shared pattern says about relationships.
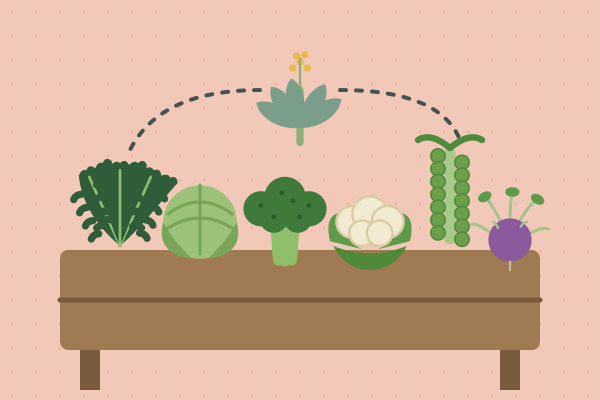 Lesson 4 · 50–60 min · 9 pagesHow fast can people change a species?Teams rotate through five printed case stations: one wild plant that became cabbage, kale, broccoli, cauliflower, kohlrabi and Brussels sprouts; dog breeds; the tame foxes of Siberia; bacteria that make human insulin; and bacteria that beat antibiotics. They graph real fox data and decide, case by case, who did the choosing: people or nature.
Students play hungry birds hunting printed light and dark peppered moths on clean and sooty bark, and graph how the moth population changes over four generations. They live through the 1977 drought on Daphne Major with finch and seed cards, then graph the real beak measurements Peter and Rosemary Grant took. They lay fossil cards of early whales in rock-layer order, from a four-legged land animal to a sea creature with tiny hind legs, and compare the bones of a human arm, a cat’s leg, a whale’s flipper, a bat’s wing and a bird’s wing. Finally they rotate through five case stations: wild cabbage to broccoli, dog breeds, the tame foxes of Siberia, insulin-making bacteria and antibiotic resistance.
By the end, students can explain natural selection as variation, inheritance and some individuals surviving and having more young, so that a population changes over generations while no individual does. They can use percentages and means to show the change, read the fossil record and shared bones as evidence of common ancestry, tell natural from artificial selection and genetic engineering, and explain why antibiotic resistance is natural selection happening now. Everything runs on printed sheets.