Years 7–9 in England and Wales · Cambridge Lower Secondary Stages 7–9 · IB MYP 1 to MYP 3, ages 11–14
Ecosystems and Biomes: Who Depends on Whom
Real wolf and moose counts from Isle Royale, a sixteen-card sort of competitors, predators, parasites and partners, six real climate graphs to match to their biomes, and a sea wall against a salt marsh. Four print-and-go lessons on populations, interactions, biomes and the services ecosystems give us.
Or try any 3 lessons free with an account. Prices in US dollars.
Already bought it? Download the whole unit as one printable workbook (67 pages): cover, contents, curriculum connections, every lesson, readings, practice pages, a unit test and an answer key, in black and white. Want to change the wording? Get every student page as one editable Word file.
4 lessons in this unit
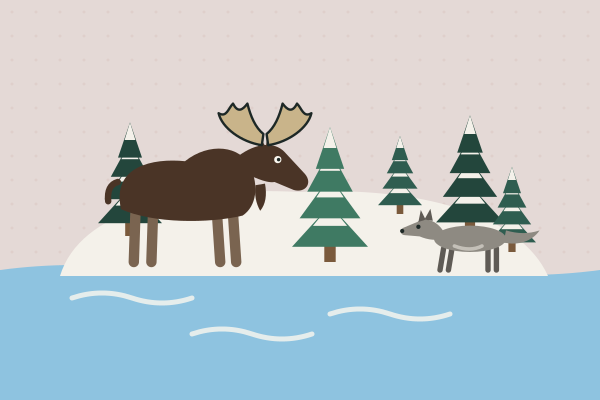 Lesson 1 · 50–60 min · 9 pagesWhat happens to a population when food runs out?Teams graph twelve years of real wolf and moose counts from Isle Royale, an island in Lake Superior, then rotate through evidence stations to explain why the moose boomed to about 2,400 and crashed to about 500. They finish by predicting what happens to any population when its food runs short.
 Lesson 2 · 50–60 min · 8 pagesAre living things competitors, predators or partners?Teams sort sixteen real pairs of living things, from coral reefs, savannas, forests and deserts, into competition, predation, parasitism, mutualism and commensalism, then stand in the room as a human chart to find the pattern. They explain why the same five kinds of interaction turn up in every ecosystem on Earth.
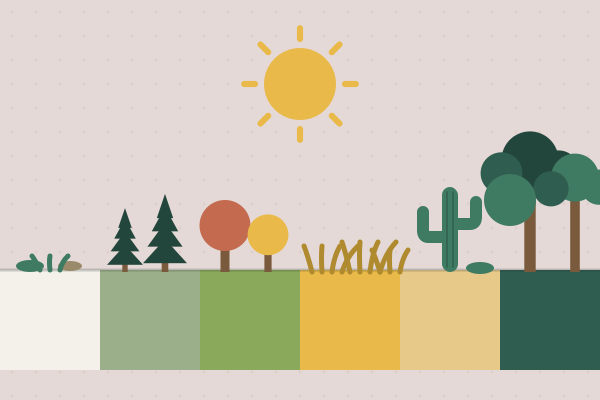 Lesson 3 · 50–60 min · 10 pagesWhat makes a biome?Teams read six real climate graphs, from Manaus to Utqiaġvik, and match each one to a biome and to the plants and animals that live there. They explain how temperature and rainfall through the year decide which living things can survive in a place.
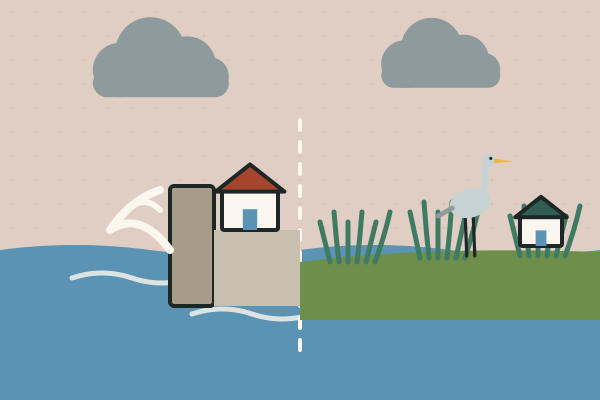 Lesson 4 · 55–60 min · 8 pagesHow can we protect an ecosystem's services?Teams weigh the real, still-debated evidence from Yellowstone's wolves to see how one change spreads through an ecosystem. Then they act as a town's planning team and score three ways to protect a flooding coast, a sea wall, a restored salt marsh and a mix of both, for protection, cost and the services nature gives for free.
Students start with twelve years of real counts from Isle Royale, an island in Lake Superior where scientists have counted wolves and moose almost every winter since 1959, and graph the moose boom and crash. They sort sixteen real pairs of living things, from reef fish to desert bats, into competition, predation, parasitism, mutualism and commensalism, and match six real climate graphs, from Manaus to Utqiaġvik, to their biomes and the plants and animals that live there. They finish by weighing the still-debated evidence from Yellowstone’s wolves and scoring a sea wall against a restored salt marsh for a flooding town.
By the end, students can explain how food and other resources limit a population, predict the kinds of interaction they will find in any ecosystem, read a climate graph and say why it supports a rainforest or a tundra, and judge a design by the ecosystem services it keeps or loses. Every lesson needs only the printed sheets.