Years 6–9 in England and Wales · Cambridge Primary Stage 6 to Lower Secondary Stage 9 · IB PYP to MYP 3, ages 10–14
Our Changing Planet: Resources and Human Impact
Where the copper, cobalt, lithium, oil and sand in a phone come from and why, which energy sources refill and which do not, what real population and energy data say about people and resources, and how real towns cut their waste. Four no-materials lessons built on printed data cards, with a hopeful, evidence-first tone for Earth Day or any time.
Or try any 3 lessons free with an account. Prices in US dollars.
Already bought it? Download the whole unit as one printable workbook (68 pages): cover, contents, curriculum connections, every lesson, readings, practice pages, a unit test and an answer key, in black and white. Want to change the wording? Get every student page as one editable Word file.
4 lessons in this unit
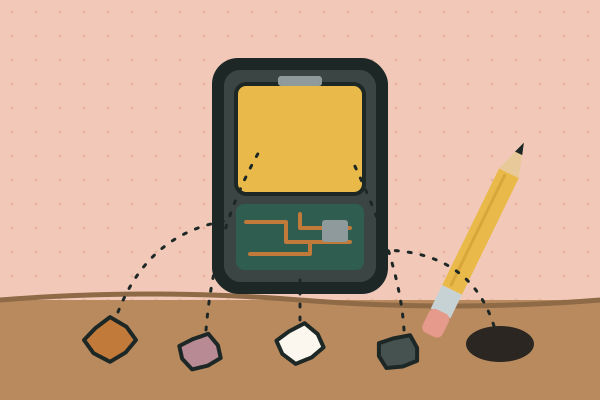 Lesson 1 · 50–60 min · 8 pagesWhere does your stuff come from?Teams trace eight ingredients of a phone and a pencil, from copper and cobalt to wood and rubber, using real production data, then sort them into renewable and non-renewable and walk a human world map. They explain why each resource is found where it is.
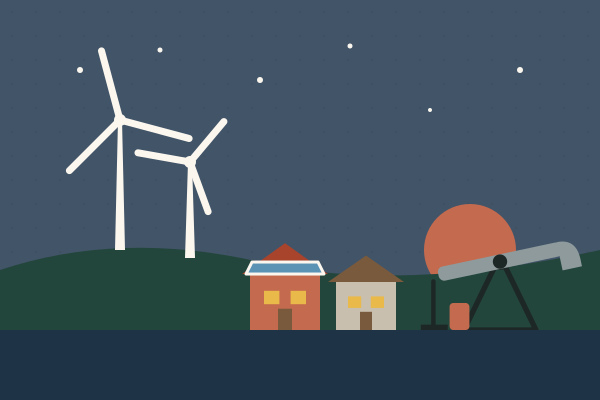 Lesson 2 · 50–60 min · 9 pagesWill our energy ever run out?Teams line up nine energy sources on a human timeline of how long nature takes to replace them, from eight minutes for sunlight to millions of years for oil, then use real 2025 data on how the world makes its electricity. They explain what renewable and non-renewable really mean.
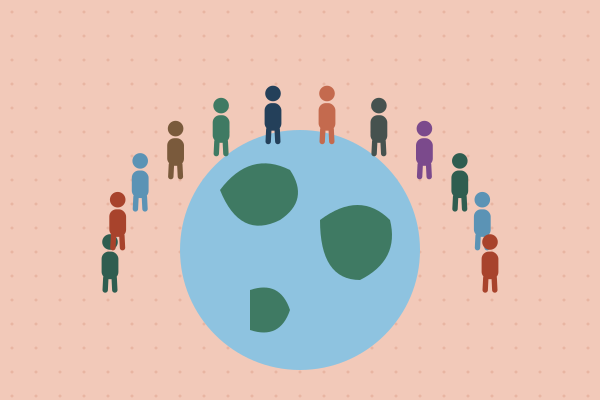 Lesson 3 · 50–60 min · 9 pagesDo more people always use more resources?Teams multiply real 2024 population and energy-per-person figures for six countries and find that the country with the most people is not the one that uses the most energy. They build an argument from evidence about how population and use per person together affect Earth's systems.
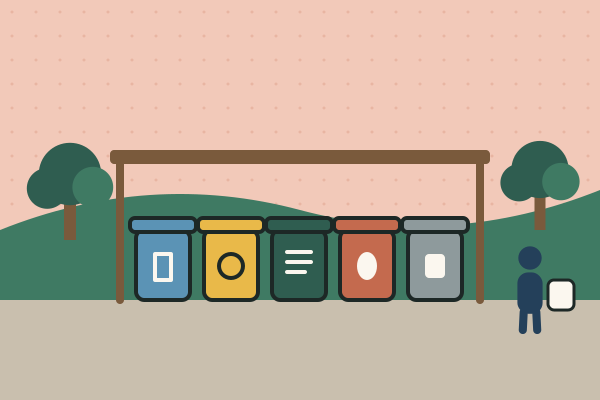 Lesson 4 · 50–60 min · 10 pagesHow can a town use less and waste less?Teams act as a town council with a waste problem. They rotate around four stations describing what real places did, from Ljubljana's food-waste collection to Kamikatsu's 45 sorting bins, score each against criteria and constraints, and design a plan with a way to measure whether it works.
Students trace eight ingredients of a phone and a pencil back to the rocks, seas and forests they came from, and find out why most of the world’s cobalt comes from one country and most of its copper from the Andes. They sort energy sources by how long nature takes to replace them, from eight minutes for sunlight to millions of years for oil, and use real 2025 data on how the world makes its electricity. They multiply real population and energy-per-person figures to see why the country with the most people is not the one that uses the most, and then act as a town council, comparing what Ljubljana in Slovenia and Kamikatsu in Japan actually did about waste.
By the end, students can explain that mineral and energy resources sit where geology put them, tell renewable from non-renewable resources by how fast they are replaced, argue from evidence that total use depends on both the number of people and how much each person uses, and design a plan with criteria, constraints and a way to measure whether it works. Every lesson needs only printed sheets. The tone is factual and hopeful: the same data that shows the problem shows real places doing better. A good unit for Earth Day (22 April), and for any month.