Years 7–8 in England and Wales · Cambridge Lower Secondary Stages 7–8 · IB MYP 1 to MYP 2, ages 11–13
Mix It, Pace It: Ratio, Rate and Percent
Why doesn't the big batch of paint match? Who walks fastest? Is the bigger pack or the bigger percent off really the better deal? Does twice the time mean twice the distance? Four lessons where students mix, walk, shop and graph their way to ratios, unit rates, percents and proportional relationships.
Or try any 3 lessons free with an account. Prices in US dollars.
Already bought it? Download the whole unit as one printable workbook (59 pages): cover, contents, curriculum connections, every lesson, readings, practice pages, a unit test and an answer key, in black and white. Want to change the wording? Get every student page as one editable Word file.
4 lessons in this unit
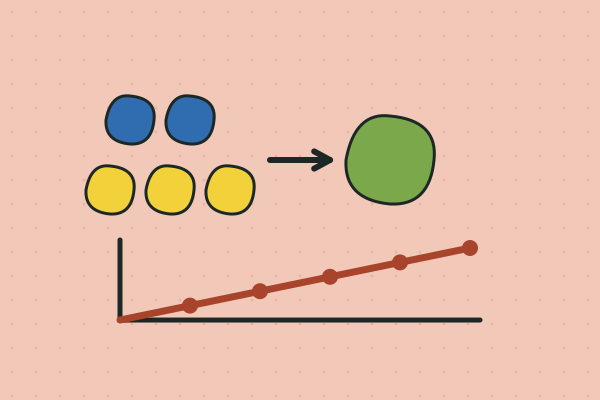
 Lesson 1 · 50–60 min · 8 pagesWhy doesn't the big batch match?Teams mix a green paint from 2 spoons of blue and 3 of yellow, then try to make a bigger batch that matches. Adding 2 more spoons of each gives a different green; doubling both gives a perfect match. Students explain ratios, equivalent ratios and ratio tables, and part-to-part and part-to-whole ratios.
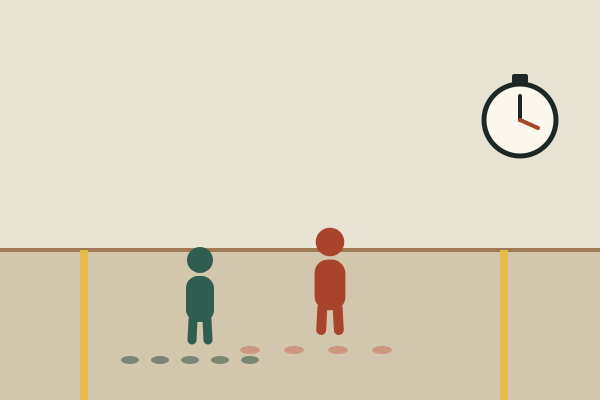 Lesson 2 · 50–60 min · 7 pagesWho walks fastest?Students time themselves walking 20 m and count their steps, then work out metres per second, steps per second and metres per step. The surprise: the walker who takes the most steps per second is often not the fastest. Students explain rates and unit rates, compare them, and convert metres per second to kilometres per hour.
 Lesson 3 · 45–60 min · 9 pagesWhich is the better deal?Teams shop from printed store cards, working out the price of one notebook or one litre to find the real best buys, and discover that the bigger package isn't always cheaper and the bigger percent off doesn't always save more money. Students use unit prices, percent as a rate per 100, and find a part, a whole or a percent.
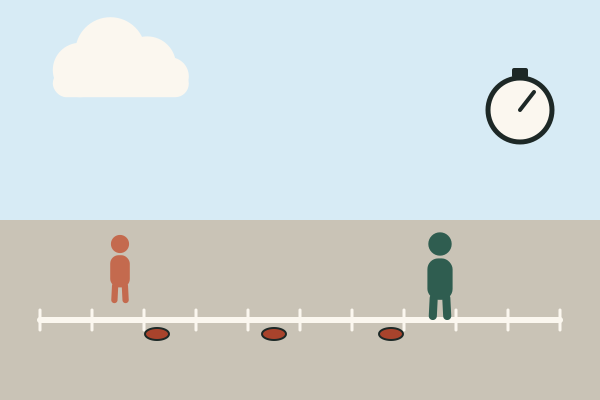 Lesson 4 · 50–60 min · 8 pagesDoes twice the time mean twice the distance?A walker moves at a steady pace while teammates mark where they are every 5 seconds, then the class graphs distance against time. A steady walker's points make a straight line through zero, but a walker with a head start doesn't. Students identify proportional relationships from tables and graphs, find the constant of proportionality and write it as an equation.
Materials for the whole unit · one list, lesson by lesson
Lesson 1: Why doesn't the big batch match?
- Washable tempera paint, blue and yellowAbout 15 spoonfuls of each per team
- Plastic spoons, all the same size4 per team
- Paper plates or wax paper, craft sticks and white paper3 plates, 2 sticks and 2 sheets per team
- Newspaper, paper towels and aprons or old shirtsEnough to cover desks
About $10 for two bottles of washable paint
Lesson 2: Who walks fastest?
- Measuring tape, 20 m (or a metre stick and patience)1 for the class
- Tape, chalk or 2 cones for the start and finish lines1 set
- Stopwatch or timer1 per team
- Calculator1 per team (optional)
Free with a measuring tape and timers you already have
Lesson 3: Which is the better deal?
- Store cards (from the Worksheet)1 set per team
Lesson 4: Does twice the time mean twice the distance?
- Measuring tape, 30 m, or metre sticks1 for the class
- Stopwatch or timer1 per team
- Beanbags, chalk or small cones to mark positions4 per team
- Graph paper1 sheet per student
Free with chalk, a measuring tape and a timer you already have
Students start with paint: 2 spoons of blue and 3 of yellow make a leaf green, but adding 2 more of each makes a different colour, while doubling both keeps it. Out in the hallway they time a 20 m walk and count their steps, and find that the walker with the quickest feet isn’t always the fastest. At a printed store, they find unit prices and percents, and discover that the biggest package isn’t always cheapest and the biggest percent off doesn’t always save the most. They finish by marking a steady walker every 5 seconds and graphing the result: a straight line through zero, unless the walker has a head start.
By the end of the unit, students can write and use ratios and ratio tables, find and compare unit rates, convert metres per second to kilometres per hour, find a percent of an amount, the percent one amount is of another and the whole from a part, and recognize a proportional relationship from its table, graph and equation d = kt. Everything uses paint, a measuring tape, timers and printed cards; store prices are made up and labelled.