Savings Planner
Set a savings goal and see how long it takes, week by week. Compare saving in a jar with earning simple or compound interest.
- Money you put in
- Interest earned
- Goal
Compare all three
How to use it
Type a goal (a bike, a gift, a class trip), what you have now and what you can save each week. The planner adds up your savings week by week and shows how long it takes. Switch between a jar, simple interest and compound interest, or look at the table to compare all three. Try the "save more" buttons to see how a small change each week moves the finish line.
It works week by week, like a bank that counts interest on your balance each week and pays it into your account at the end of each month or year. Money in a jar earns nothing; real savings accounts in Canada and the US often pay somewhere around 1% to 5% a year.
Interest, simply
Interest is money a bank pays you for keeping your savings there, as a percent of what you have each year. With simple interest you only earn on the money you put in: $100 at 5% earns $5 every year, so after 3 years you have earned $15 (interest = amount × rate × years).
With compound interest you also earn interest on your interest. $100 at 5% paid yearly becomes $105 after one year, then 5% of $105 is $5.25, giving $110.25, and so on (total = amount × (1 + rate)years). Paying monthly compounds a little faster still. Over a few months the difference is tiny, but over many years compounding makes savings grow faster and faster, which is why starting early matters more than saving a lot.
- Which helps more for a goal a few months away: a higher interest rate or saving $2 more each week?
- Change the goal to $5,000. Now how big is the difference between simple and compound?
Free to use, no account needed. It runs in your browser: nothing you type, and no sound from your microphone, is sent to Fieldbook.
Hands-on lessons to pair with Savings Planner
Ready-to-teach units, each lesson a printable teacher guide and student sheet. Your first three lessons are free.
Data Detectives
How fast are our reflexes? Which graph is telling the truth? Do taller people really have bigger hands? Three lessons where students collect their own measurements and find out what numbers can and can't tell you.
Measure It: Length, Time and Mass in the Real World
Whose foot is the right ruler? How long is a minute, really? Is a kilogram of feathers lighter than a kilogram of rocks? Four lessons where students measure length, time and mass with real tools, then use their own data to settle an argument.
Kitchen Chemistry
Fizzing, curdling and colour changes with things from the grocery store. Students gather evidence of new substances, weigh a reaction in a sealed bottle, and turn red cabbage into an acid detector.
Three full lessons, free
Make a free account and download any three Fieldbook lessons, from any grade or subject, as printable PDFs. No card needed.
More free classroom tools
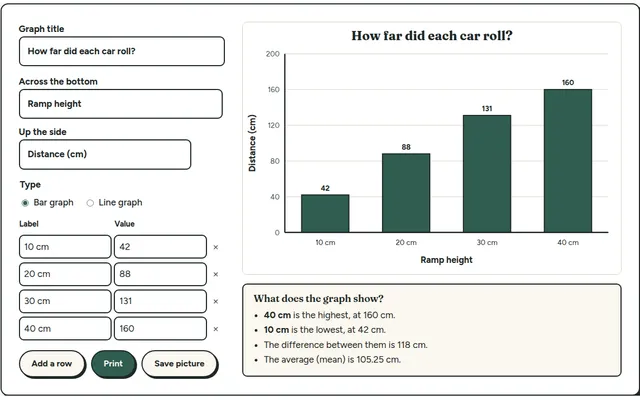
Class Graph Maker
Type in your class's results and get a clean bar or line graph to project or print. Built for the data step of every Fieldbook investigation.
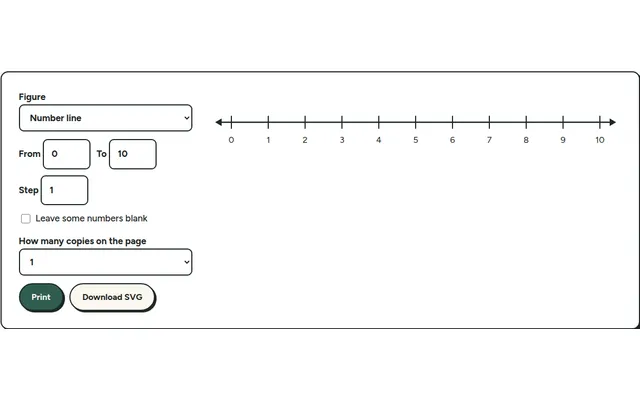
Math Figures
Printable number lines, coordinate grids, graph paper and hundred charts for worksheets and tests, sized the way you need them.
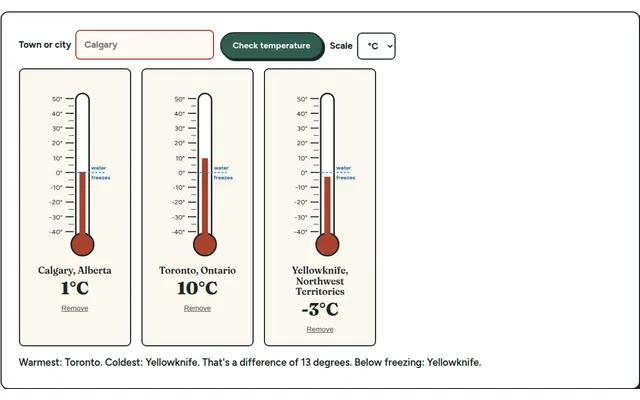
Weather Station
A live thermometer for any town. Read the scale, compare cities, and log the day's temperature for a weather unit.
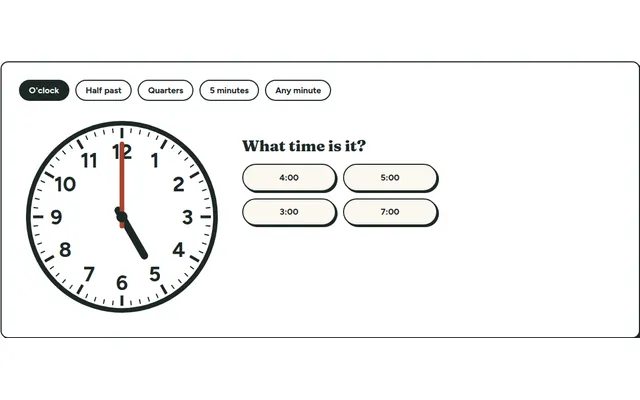
Clock Match
Read an analog clock and pick the matching time. Five levels, from o'clock up to the nearest minute.
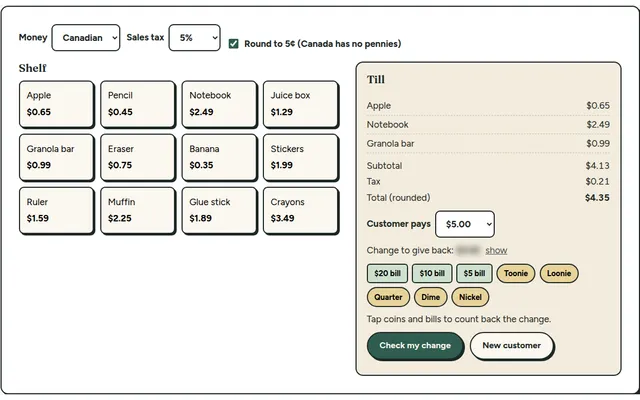
Corner Store
Ring up a pretend purchase, add sales tax and count back the change. Money practice with Canadian or US coins and bills.
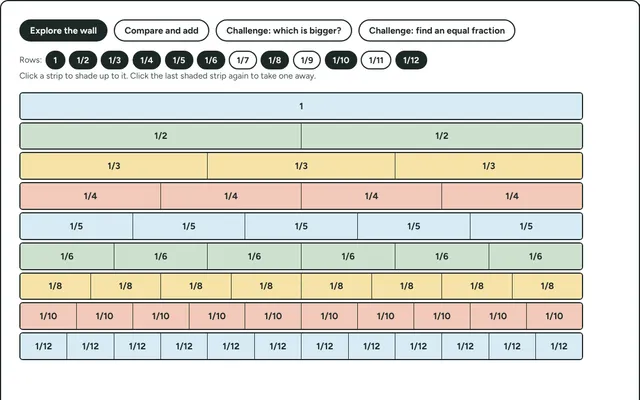
Fraction Wall
Stack fraction strips to see which fractions are equal, which is bigger, and how they add up. Then test yourself with compare-and-match challenges.