 Preview · the opening mission
Read this to the class:
A student finds an old science paper from 1866, written in German by a friar who spent eight years growing peas. His idea is bold: every pea plant carries two "factors" for each trait, and passes on one at random. Today we would call them alleles. If he is right, crossing two hybrid plants should give three plants showing the dominant trait for every one showing the recessive trait. The paper is full of numbers. Your team's job: check Mendel's numbers and decide whether his data really support 3 to 1.
Teams of three, with three rotating jobs: Reader (reads the card aloud), Calculator (works out the ratio) and Recorder (fills in the table).
Look inside the PDF
Sample pages, stamped “preview”. The download is the clean, full lesson.
In the full lesson PDF
8 printable pages
- Predict (5–10 min)
- Hunt (20 min)
- Reveal (10–15 min)
- Act (10 min)
- Background for the teacher
- Assessment
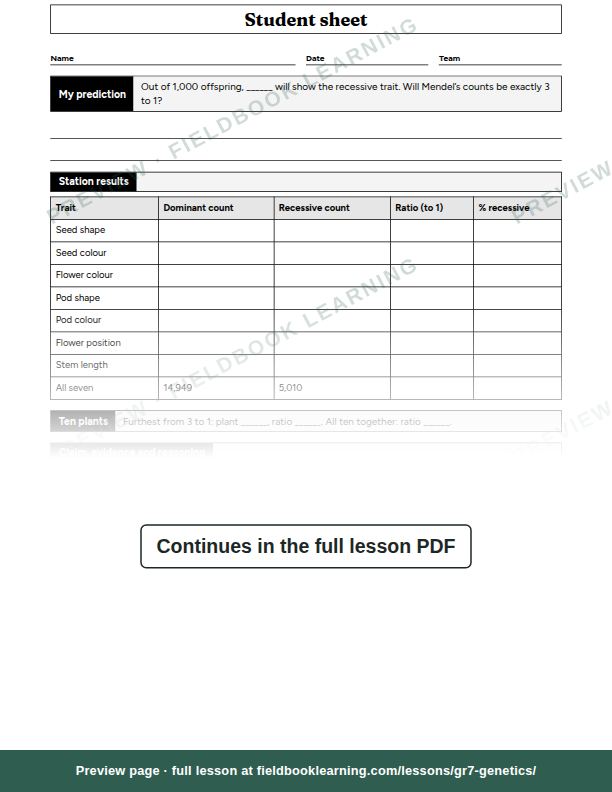
- Student sheet
- Worksheet: Mendel data cards
- Worksheet: Label it
- Worksheet: Try it at home
On the student sheet
- My prediction
- Station results
- Ten plants
- Claim, evidence and reasoning
- Exit ticket
- Mendel data cards
- Label it
- Try it at home
US Letter, prints cleanly in black and white. The student sheet is on its own page, ready to photocopy.
Free with an account (any 3 lessons), or US$19 for all 4 lessons in this unit.
What students show by the end
- Calculates ratios
- Compares with prediction
- Reasons with probability
From the lesson’s rubric, which scores each one as not yet, getting there or got it.
Questions teachers ask
How long does “What did Mendel count?” take?
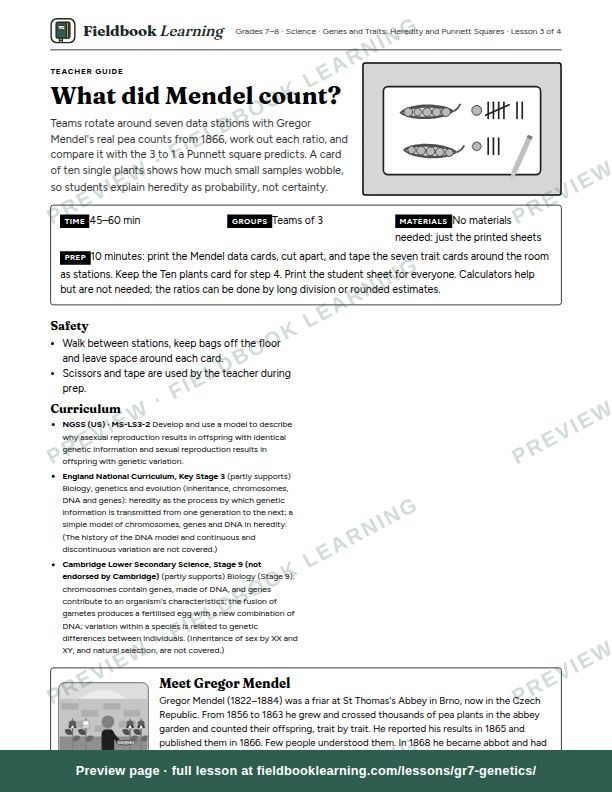
45–60 min. Group size: teams of 3.
How much prep does it need?
10 minutes: print the Mendel data cards, cut apart, and tape the seven trait cards around the room as stations. Keep the Ten plants card for step 4. Print the student sheet for everyone. Calculators help but are not needed; the ratios can be done by long division or rounded estimates.
What materials do I need?
None. No materials needed: just the printed sheets.
Which curriculum standards does it cover?
NGSS (US): MS-LS3-2. It also matches England National Curriculum, Key Stage 3 and Cambridge Lower Secondary Science, Stage 9 (not endorsed by Cambridge).
What’s in the lesson PDF?
A teacher guide that walks you through predict, hunt, reveal, act, background for the teacher and assessment, then a student sheet (“My prediction”; “Station results”; “Ten plants”; “Claim, evidence and reasoning”; “Exit ticket”; “Mendel data cards”; “Label it” and “Try it at home”) on its own page, ready to photocopy. It’s US Letter and prints cleanly in black and white.
Can I try it for free?
Yes. A free account includes any 3 full lessons of your choice, and this can be one of them. After that, this unit is US$19 for all 4 lessons, yours to keep, or every lesson is US$199 a year.