Plant Growth Journal
Log your class plants' height every few days and get a growth chart that compares plants or conditions. Saved on your device, ready to print.
Growth chart
All measurements
How to use it
Add each plant with the condition it is growing in, then measure it every few days from the soil to the tip of the tallest shoot and log the height. The chart lines all start at the day each plant was planted, so plants started on different days can still be compared fairly. Press Load sample data to see how it works before your seeds are up.
The journal is saved in this browser on this device only. Use Download CSV to keep a copy or open it in a spreadsheet, and Print for the class bulletin board.
Reading a growth chart
A steeper line means faster growth. Growth per day is the change in height divided by the number of days between two measurements, so a plant that grew 6 cm in 3 days grew 2 cm per day. Most seedlings start slowly, speed up once their leaves are making food, and later level off.
Watch for a surprise: a bean kept in a dark cupboard often grows taller at first than one on a sunny sill. It is stretching to find light, using the food stored in the seed. Its stem is pale, thin and floppy, with few small leaves, and once the seed's store is used up it stops growing. Height alone is not the whole story, which is why the journal also records leaves and notes.
- Which plant grew fastest between day 6 and day 12? How can you tell from the line?
- Is our test fair? What did we keep the same (seed type, pot, soil, water)?
- What would you measure besides height to decide which plant is healthiest?
Free to use, no account needed. It runs in your browser: nothing you type, and no sound from your microphone, is sent to Fieldbook.
Hands-on lessons to pair with Plant Growth Journal
Ready-to-teach units, each lesson a printable teacher guide and student sheet. Your first three lessons are free.
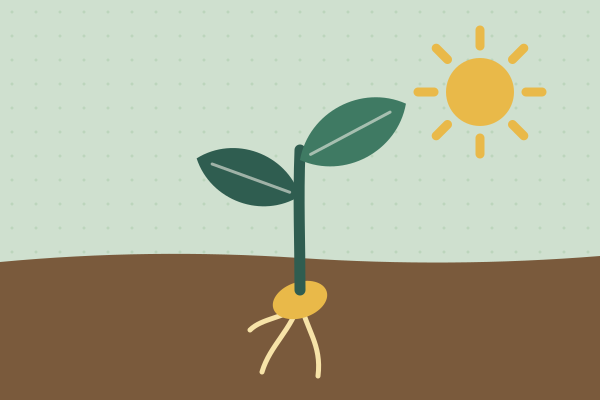
Plants and Seeds: What Does a Seed Need?
What's hiding inside a bean, and what does it need to wake up and grow? Young scientists open soaked seeds, sprout beans in bags and watch seedlings bend to find the light.

Our Living Planet
Air, water, land and living things, and how each one depends on the others. Students build a sealed jar ecosystem to keep for a month and catch the water cycle in a bag on the window.

Evidence Lab
How do you know something is true? Students test a claim with their own measurements, find out why one result is never enough, and learn to tell strong evidence from weak.
Three full lessons, free
Make a free account and download any three Fieldbook lessons, from any grade or subject, as printable PDFs. No card needed.
More free classroom tools
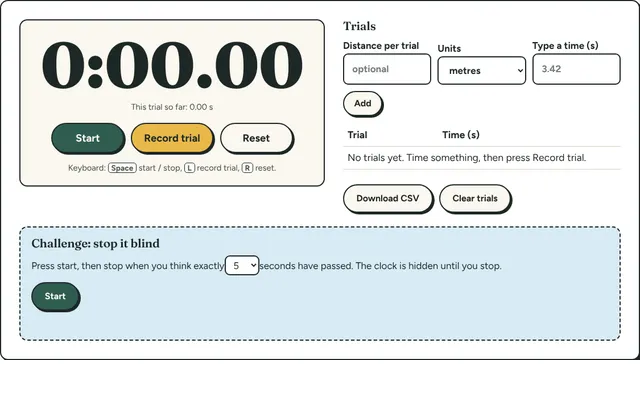
Lab Stopwatch
A big stopwatch with lap times for experiments: time several trials, see the average and spread, and download the results.
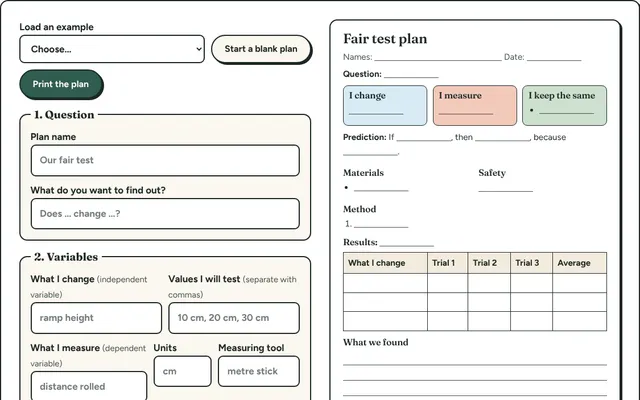
Fair Test Planner
Plan an experiment step by step: question, variables to change, measure and keep the same, prediction and method. Prints as a one-page plan.
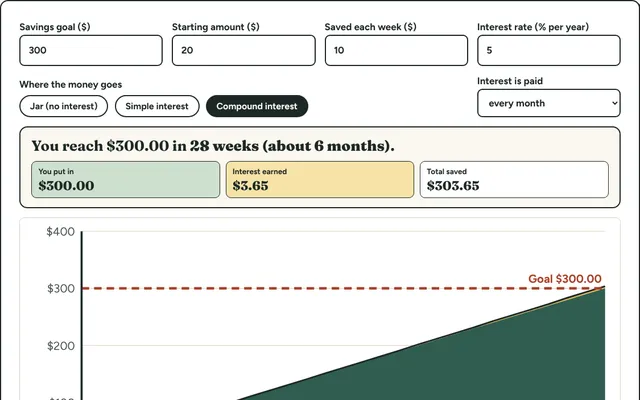
Savings Planner
Set a savings goal and see how long it takes, week by week. Compare saving in a jar with earning simple or compound interest.
Field Watch
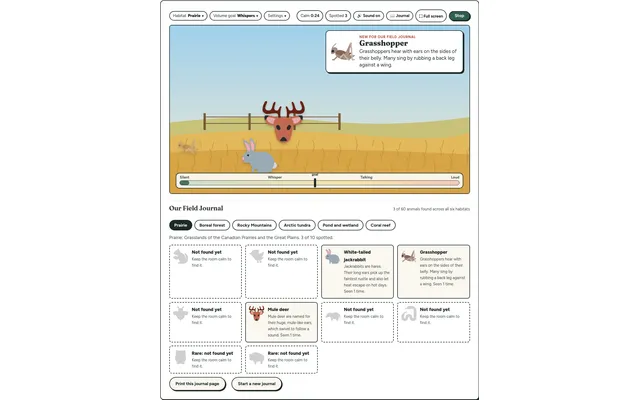
A quiet-room wildlife game for the projector. Keep the room calm and animals visit six real habitats, each with a fact to learn. Every animal spotted goes into your class Field Journal.
Class Graph Maker
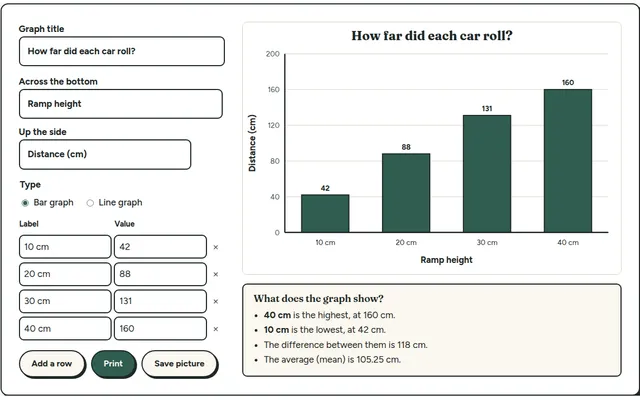
Type in your class's results and get a clean bar or line graph to project or print. Built for the data step of every Fieldbook investigation.
Math Figures
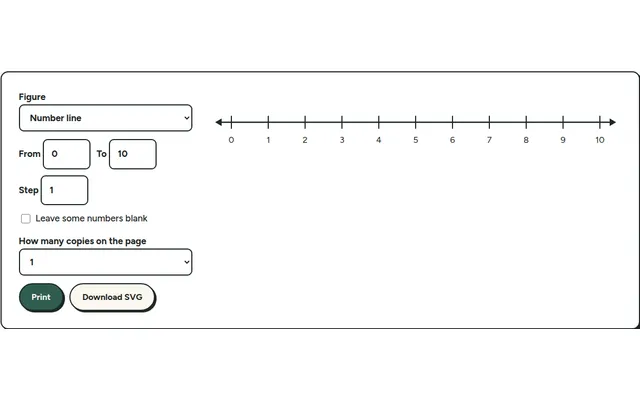
Printable number lines, coordinate grids, graph paper and hundred charts for worksheets and tests, sized the way you need them.