Mean, Median and Mode
Type in a set of numbers and see the mean, median, mode and range worked out step by step, with a dot plot that shows where each one sits.
Work these out on paper, then type your answers.
How to use it
Type or paste numbers, or load a sample and change it. Every result shows its working: the sum divided by the count for the mean, the sorted list with the middle marked for the median, how often each value appears for the mode, and the biggest minus the smallest for the range. On the dot plot, the clay triangle is the mean and the green one is the median. Press What if I add an outlier? to see which measure moves more.
Practice gives a fresh set of numbers to work out by hand, then checks each answer and explains any that are off.
Three kinds of "middle"
The mean is the fair-share value: add everything and share it out equally. The median is the middle value once the numbers are in order (with an even count, it's halfway between the two middle values). The mode is the value that appears most often; a set can have no mode, or more than one. The range isn't a middle at all: it measures spread, the distance from smallest to largest.
An outlier, one value far from the rest, drags the mean toward it but barely moves the median. That's why house prices and incomes are usually reported as medians. The quartiles here split the ordered data into quarters using the "median of each half" method (leaving out the middle value when the count is odd); some calculators use slightly different rules, so their quartiles can differ a little.
- Which measure best describes "a typical plant" if one plant got knocked over?
- Can you make a set of five numbers with mean 10 but median 6?
- When would the mode be the most useful (shoe sizes, favourite colours)?
Free to use, no account needed. It runs in your browser: nothing you type, and no sound from your microphone, is sent to Fieldbook.
Hands-on lessons to pair with Mean, Median and Mode
Ready-to-teach units, each lesson a printable teacher guide and student sheet. Your first three lessons are free.
Data Detectives
How fast are our reflexes? Which graph is telling the truth? Do taller people really have bigger hands? Three lessons where students collect their own measurements and find out what numbers can and can't tell you.
Evidence Lab
How do you know something is true? Students test a claim with their own measurements, find out why one result is never enough, and learn to tell strong evidence from weak.
Test the Claim: Science Facts, Myths and AI Answers
Sayings, ads, forum posts and AI chatbot answers all sound sure of themselves. Students put popular claims to a real hands-on test, grade the answers, and learn how to decide which sources deserve their trust.
Three full lessons, free
Make a free account and download any three Fieldbook lessons, from any grade or subject, as printable PDFs. No card needed.
More free classroom tools
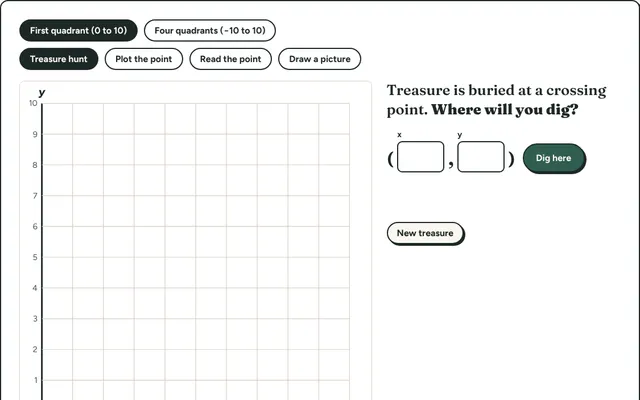
Coordinate Hunt
Find hidden treasure by plotting and reading points on a coordinate grid. First quadrant for beginners, all four quadrants for grade 6 and up.
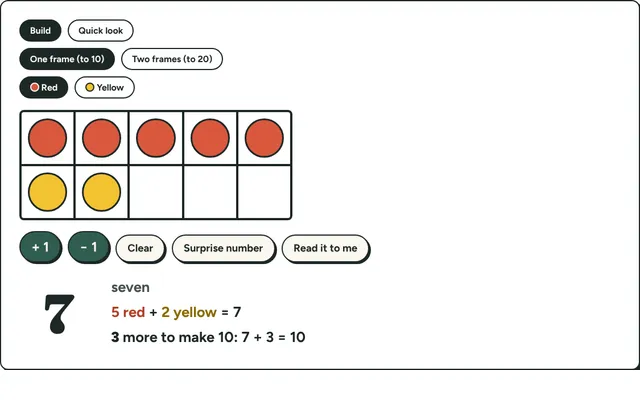
Ten Frames
Fill ten frames with counters to show numbers to 20, make ten and practise quick looks. Early number sense for kindergarten to grade 2.
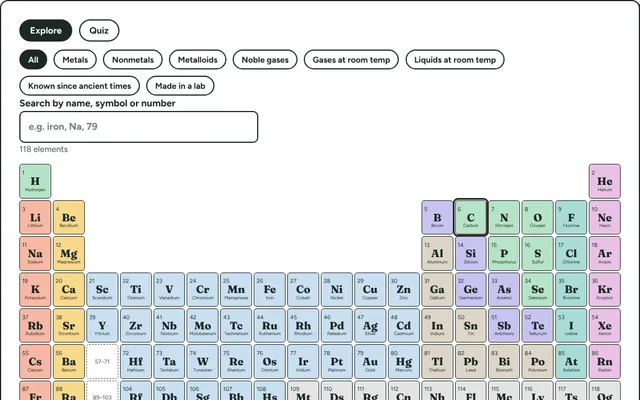
Periodic Table Explorer
All 118 elements, coloured by family. Click one for its atomic number, mass, state, discovery and an everyday use, or highlight metals, gases and more.
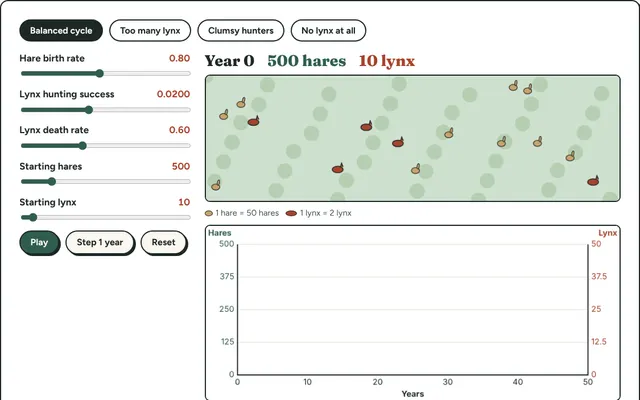
Predator and Prey
Run a simulated meadow of hares and lynx. Change birth and hunting rates and watch the two populations rise and fall on a live graph.
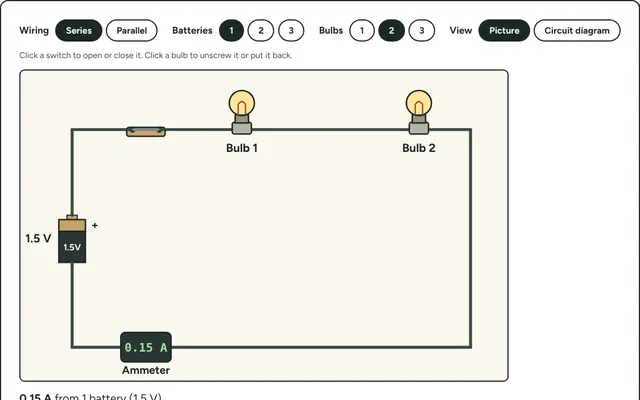
Circuit Lab
Wire batteries and bulbs in series or parallel, flip switches and see which bulbs light, how bright, and how much current flows.
States of Matter
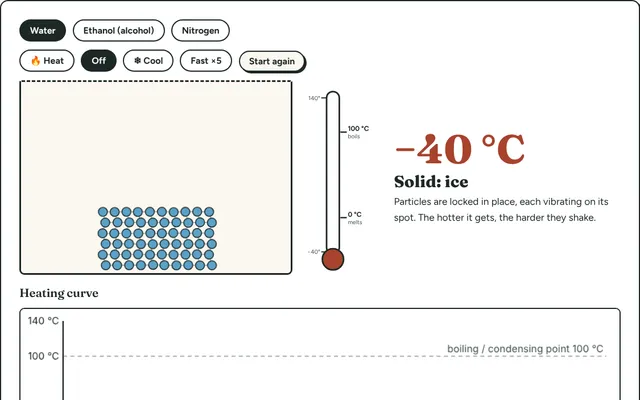
Heat and cool a box of particles and watch them pack into a solid, slide as a liquid and fly apart as a gas, with a live thermometer.