Probability Lab
Flip coins, roll dice or spin a spinner hundreds of times and compare what happened with what probability predicts.
2. Run trials
What happened What probability predicts
| Result | Count | Observed | Theory |
|---|
How to use it
Choose a coin, one die, two dice or a spinner. Make a prediction first, then run trials: 1 or 10 at a time to watch each result, 100 or 1000 to see the big picture. The bars show what actually happened; the dashed lines show what probability predicts. The table gives the same numbers as fractions and percents.
With the spinner, change the labels, colours and sizes of the sections. A section with size 2 is twice as big as one with size 1, so it should come up about twice as often.
Probability and the law of large numbers
The theoretical probability of a result is the number of ways it can happen divided by the number of equally likely outcomes. A fair coin lands heads 1 out of 2 times. Two dice have 36 equally likely combinations, and 6 of them add to 7 (1+6, 2+5, 3+4, 4+3, 5+2, 6+1), so a sum of 7 has a probability of 6/36, or 1/6. Only one combination makes 2 or 12.
The experimental probability is what you actually observe: count divided by trials. In a small number of trials it can be far from the theory (three heads in a row is common). The law of large numbers says that as the number of trials grows, the observed fractions settle closer and closer to the theoretical ones. Watch the "biggest gap" number shrink as you add hundreds of trials. Each single flip is still unpredictable: the coin does not "remember" past flips or try to even things out.
- Ask before running: "If we flip 10 times, will we get exactly 5 heads?" Then try it a few times.
- Why is 7 the most common sum but 1 impossible with two dice?
- Design a spinner where red wins about 3 times out of 4. What sizes did you use?
Free to use, no account needed. It runs in your browser: nothing you type, and no sound from your microphone, is sent to Fieldbook.
Hands-on lessons to pair with Probability Lab
Ready-to-teach units, each lesson a printable teacher guide and student sheet. Your first three lessons are free.

Data Detectives
How fast are our reflexes? Which graph is telling the truth? Do taller people really have bigger hands? Three lessons where students collect their own measurements and find out what numbers can and can't tell you.
Test the Claim: Science Facts, Myths and AI Answers
Sayings, ads, forum posts and AI chatbot answers all sound sure of themselves. Students put popular claims to a real hands-on test, grade the answers, and learn how to decide which sources deserve their trust.
Evidence Lab
How do you know something is true? Students test a claim with their own measurements, find out why one result is never enough, and learn to tell strong evidence from weak.
Three full lessons, free
Make a free account and download any three Fieldbook lessons, from any grade or subject, as printable PDFs. No card needed.
More free classroom tools
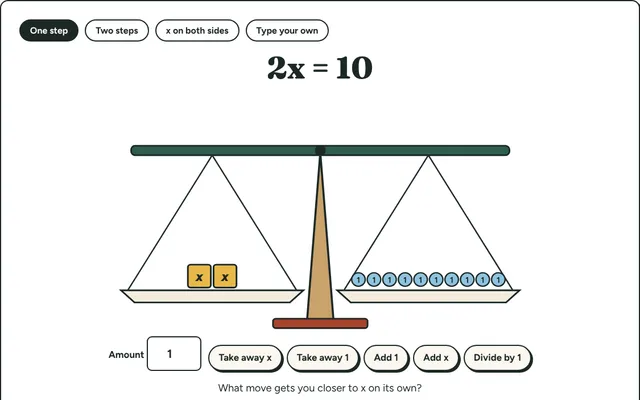
Equation Balance
Solve equations on a balance scale: do the same thing to both sides until x stands alone. Step-by-step algebra for grades 6 to 8.
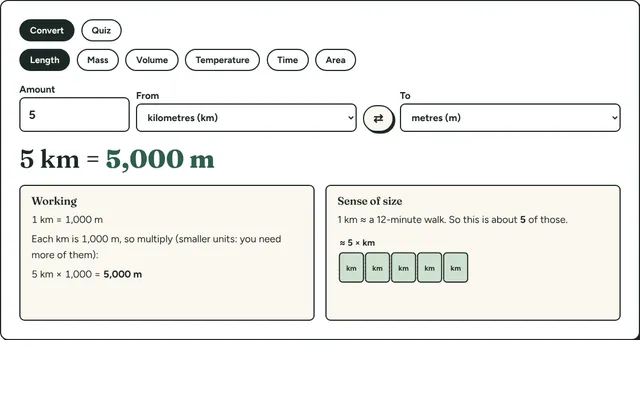
Measurement Converter
Convert length, mass, volume, temperature and time between metric and imperial units, with the working shown and a sense-of-size picture for each.
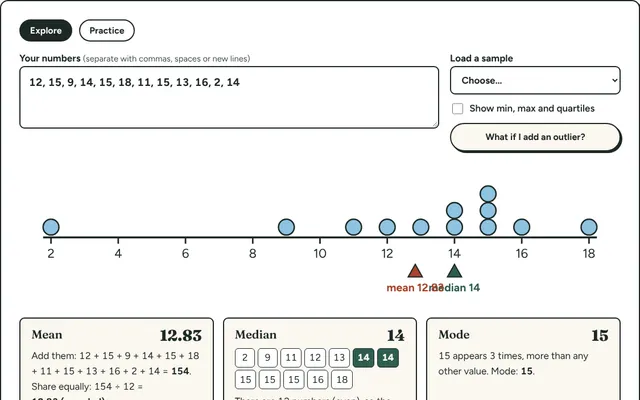
Mean, Median and Mode
Type in a set of numbers and see the mean, median, mode and range worked out step by step, with a dot plot that shows where each one sits.
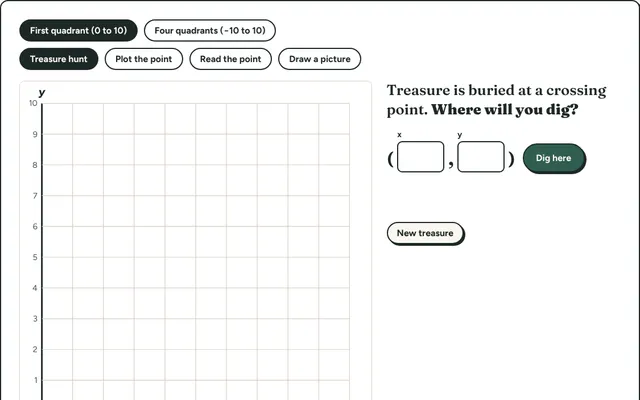
Coordinate Hunt
Find hidden treasure by plotting and reading points on a coordinate grid. First quadrant for beginners, all four quadrants for grade 6 and up.
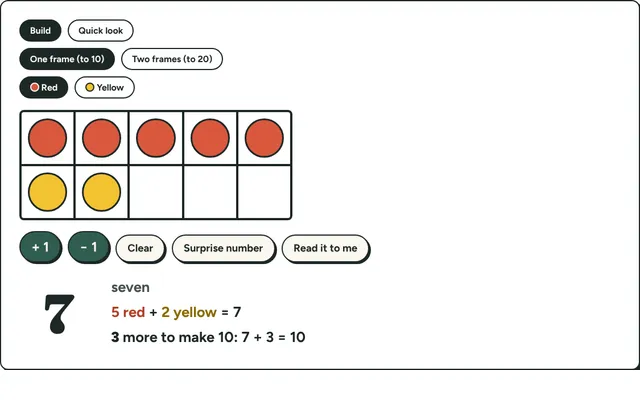
Ten Frames
Fill ten frames with counters to show numbers to 20, make ten and practise quick looks. Early number sense for kindergarten to grade 2.
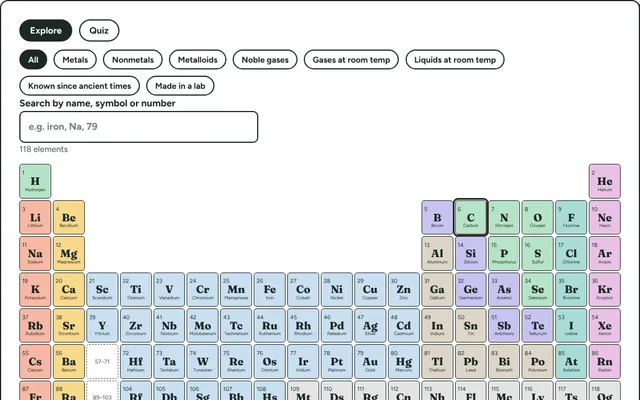
Periodic Table Explorer
All 118 elements, coloured by family. Click one for its atomic number, mass, state, discovery and an everyday use, or highlight metals, gases and more.