Hundred Chart
An interactive 100 or 120 chart. Shade skip-counting patterns, hide numbers for a missing-number puzzle, and jump by tens and ones.
Hundred Chart · free from Fieldbook Learning
How to use it
Choose a chart: 1 to 100, 0 to 99 or 1 to 120. Then pick what to do.
Colour: pick a colour and click squares to shade them, for example all the numbers with a 7 in them. Skip count: choose a number to count by (2 to 12) and where to start. The squares fill in one at a time so the class can count along, and the pattern builds as you go. Count again in a second colour to see the numbers that are in both counts.
Hide numbers: cover every square, a random handful, or the ones you click. Covered squares show a question mark. Missing number game: some squares are covered and one is outlined in gold. Type the number that belongs there. Wrong answers get a hint from a neighbouring square, and the tool keeps score. Jump by tens and ones: type a start number and how many tens and ones to add or subtract. The tool draws the jumps on the chart, tens first, and writes the equation, such as 34 + 23 = 57.
Use Full screen on a projector or interactive whiteboard, or Print to make a coloured chart or a missing-number sheet.
Why the hundred chart matters
The hundred chart is a picture of place value. Every row is a new ten, so moving down one square adds ten and moving right one square adds one. Adding 23 to 34 is two jumps down and three across: 34, 44, 54, then 55, 56, 57. Children who can see this start adding and subtracting tens in their heads instead of counting by ones.
Skip counting on the chart turns multiplication facts into patterns. Counting by 10 makes a single column, counting by 5 makes two columns, counting by 2 shades every other column, and counting by 9 or 11 makes diagonals. Counting by 3 or 4 makes slanted patterns that are worth describing in words. Spotting where two counts overlap (2s and 3s meet at 6, 12, 18) is an early look at common multiples.
The 0 to 99 chart puts every number with the same tens digit in the same row, so 40 to 49 sit together. The 120 chart goes past 100 so children see that 101, 102, 103 follow the same pattern as 1, 2, 3, which is where many counting errors happen.
- What is the same about every number in one column? In one row?
- Start at 47. Where do you land if you jump down 3 rows? What did you add?
- Count by 4s and by 6s in two colours. Which numbers get both colours?
- Hide 10 numbers. How can you work out a hidden number without counting from 1?
Free to use, no account needed. It runs in your browser: nothing you type, and no sound from your microphone, is sent to Fieldbook.
Hands-on lessons to pair with Hundred Chart
Ready-to-teach units, each lesson a printable teacher guide and student sheet. Your first three lessons are free.
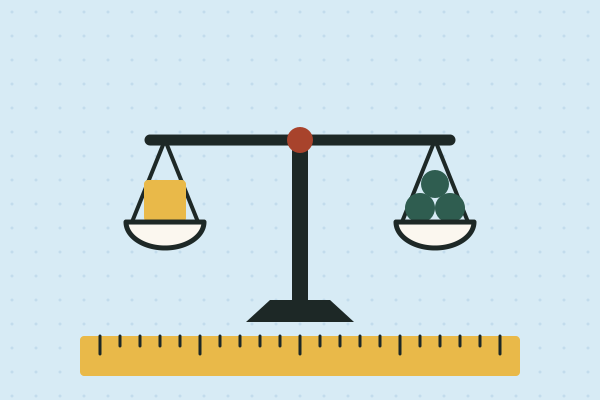
Measure It: Length, Time and Mass in the Real World
Whose foot is the right ruler? How long is a minute, really? Is a kilogram of feathers lighter than a kilogram of rocks? Four lessons where students measure length, time and mass with real tools, then use their own data to settle an argument.

Data Detectives
How fast are our reflexes? Which graph is telling the truth? Do taller people really have bigger hands? Three lessons where students collect their own measurements and find out what numbers can and can't tell you.
Evidence Lab
How do you know something is true? Students test a claim with their own measurements, find out why one result is never enough, and learn to tell strong evidence from weak.
Three full lessons, free
Make a free account and download any three Fieldbook lessons, from any grade or subject, as printable PDFs. No card needed.
More free classroom tools
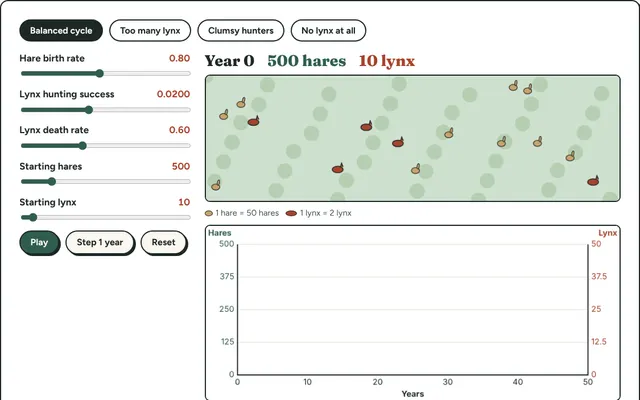
Predator and Prey
Run a simulated meadow of hares and lynx. Change birth and hunting rates and watch the two populations rise and fall on a live graph.
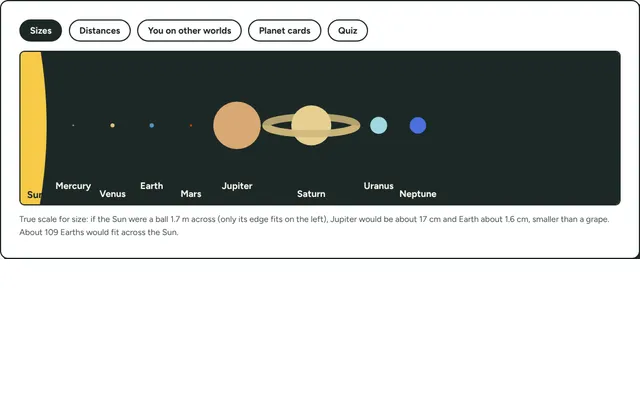
Solar System Scale
See the planets at true scale for size and distance, find your weight and age on each one, and work out how long light takes to reach them.
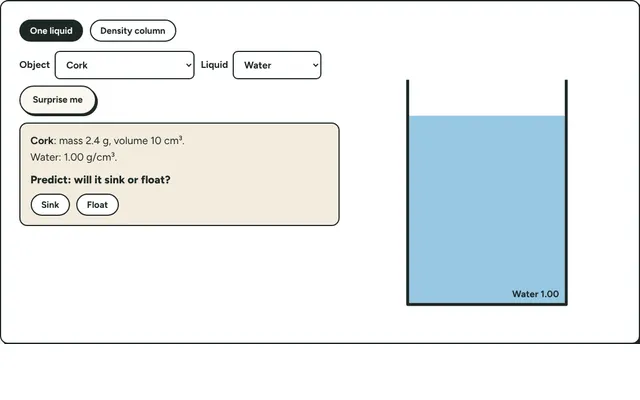
Sink or Float
Drop objects into water, oil, salt water or syrup. Predict first, then see what sinks and floats and why, using mass, volume and density.
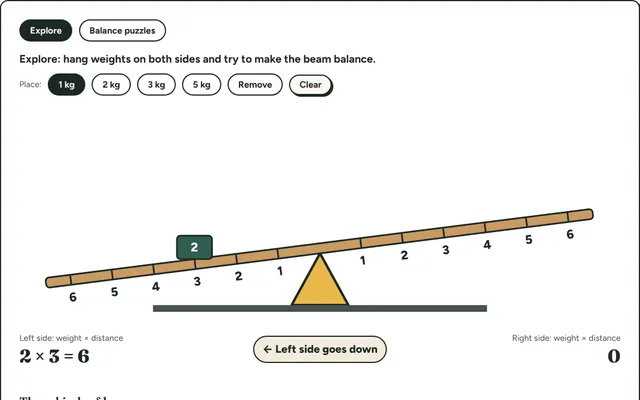
Lever Lab
Put weights on a seesaw and balance it. Discover the law of the lever (weight times distance) by experiment, then solve balance puzzles.
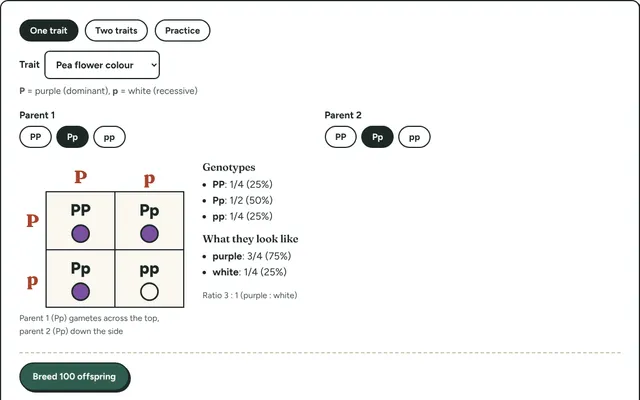
Punnett Squares
Cross two parents and see every possible offspring, with the ratios of genotypes and traits, plus a breeding simulator to test the prediction.
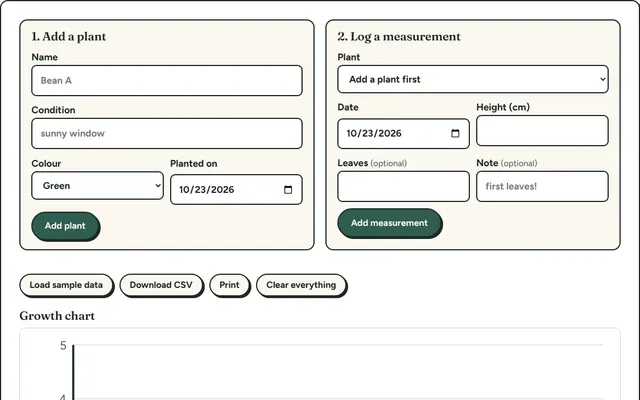
Plant Growth Journal
Log your class plants' height every few days and get a growth chart that compares plants or conditions. Saved on your device, ready to print.