Water Cycle
Turn up the sun and watch water evaporate, condense into clouds and fall as rain or snow, then follow one drop of water on its journey.
Follow a drop
Quiz
Water Cycle · free from Fieldbook Learning
How to use it
Press Watch the cycle and the landscape comes alive. Water vapour rises from the ocean and trees, gathers into clouds and falls as rain or snow, then runs off into the river or soaks into the ground. Turn up the sun for faster evaporation. Lower the air temperature to make snow pile up on the mountain, then raise it and watch the snowmelt fill the river. Turn up the wind to push clouds over the land, where the mountains force them up and they drop their water.
Tap any label, or any part of the picture, for a short explanation. Follow a drop tells the story of one drop step by step, with random turns: it might be back in the ocean in a week, or stuck in a glacier or deep groundwater for thousands of years. The Quiz has eight questions; some ask you to click the right part of the picture. With reduced motion turned on, the picture starts paused and moves on with Next step.
The water cycle explained
The water cycle is the endless journey of water between the oceans, the air and the land. The sun drives it: its energy makes water evaporate from oceans, lakes and soil, and plants give off vapour through their leaves in transpiration. As the vapour rises, it cools and condenses into the tiny droplets and ice crystals that make clouds. When they grow heavy, they fall as precipitation: snow if the air is below freezing all the way down, rain if the snow melts on the way. On land, water runs off into rivers, soaks into the soil (infiltration) or is stored as snow, ice and groundwater, and gravity slowly brings it back to the sea, where it collects.
Water is never used up. It only changes place, and changes between solid, liquid and gas. How long it stays depends on the place: about 9 days in the air, weeks to months in a river, a season in a snowpack, about 3,000 years in the ocean, and from months to more than 10,000 years underground or in ice sheets. The picture is a simple model: real clouds hold far more water, and real groundwater moves much more slowly.
The water cycle is also the engine of our weather: clouds, rain, snow, fog and dew are all part of it. The mountains show why the side facing the wind is often the wettest.
- Why is there more rain on the mountain than over the low land?
- Put a bowl of water in a sunny window and one in the shade. Which empties first, and where did the water go?
- Follow three drops each. Who had the longest trip? Who got stuck?
Free to use, no account needed. It runs in your browser: nothing you type, and no sound from your microphone, is sent to Fieldbook.
Hands-on lessons to pair with Water Cycle
Ready-to-teach units, each lesson a printable teacher guide and student sheet. Your first three lessons are free.
Weather Detectives
Warm winter winds, the hottest spot in the schoolyard and the last frost of spring. Students measure weather fairly and find out why farmers care so much about it.
Weather Watchers: What Will the Sky Do Today?
Is it sunny, windy or wet today, and how can we tell? Young scientists keep a class weather chart for two weeks, build wind socks to catch the wind and make a rain gauge from a bottle to measure the rain.

Climate Clues
Tree rings, old weather records and what your own town's numbers say. Three lessons on how scientists tell climate apart from a cold week.
Three full lessons, free
Make a free account and download any three Fieldbook lessons, from any grade or subject, as printable PDFs. No card needed.
More free classroom tools
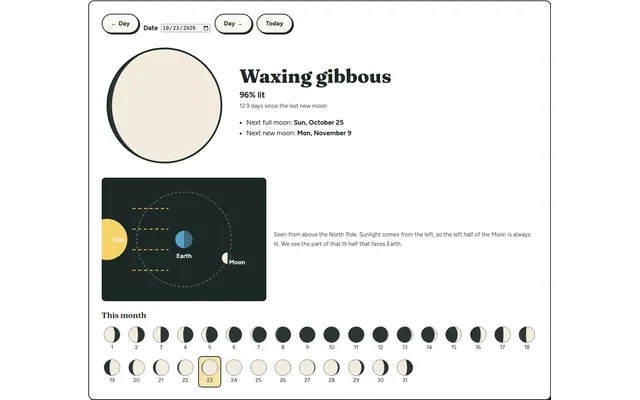
Moon Phase Finder
Pick any date and see the Moon's phase, how much of it is lit and when the next full and new moons are. Pairs with our Sun, Earth and Moon unit.
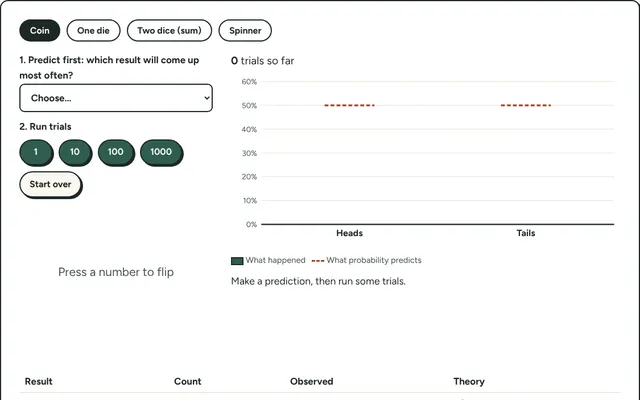
Probability Lab
Flip coins, roll dice or spin a spinner hundreds of times and compare what happened with what probability predicts.
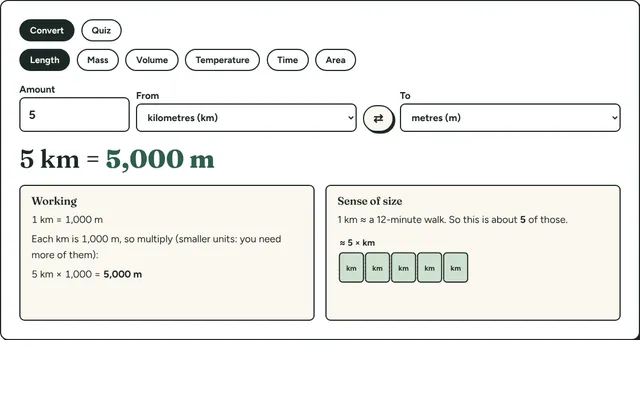
Measurement Converter
Convert length, mass, volume, temperature and time between metric and imperial units, with the working shown and a sense-of-size picture for each.
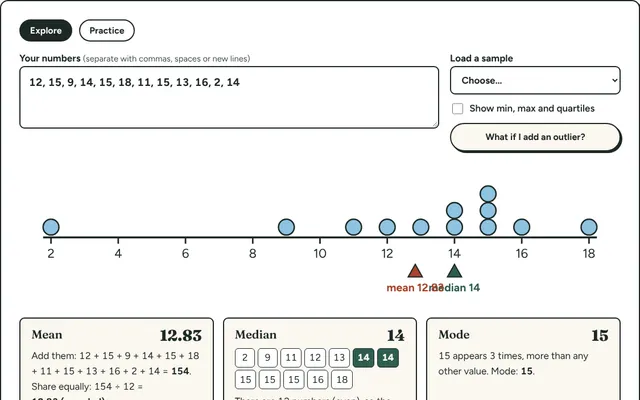
Mean, Median and Mode
Type in a set of numbers and see the mean, median, mode and range worked out step by step, with a dot plot that shows where each one sits.
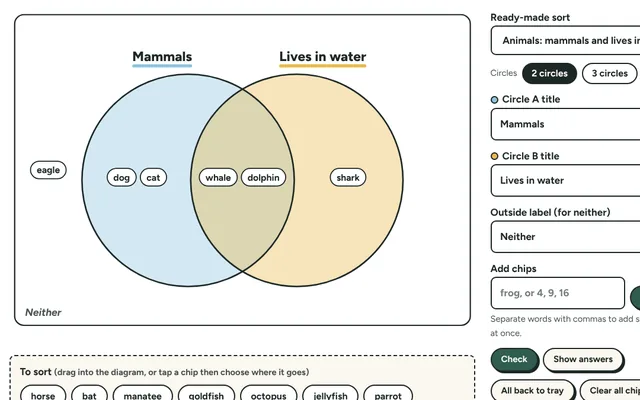
Venn Diagram Maker
Sort words, numbers or pictures into two or three overlapping circles. Start from a ready-made sort or type your own, then print the finished diagram.
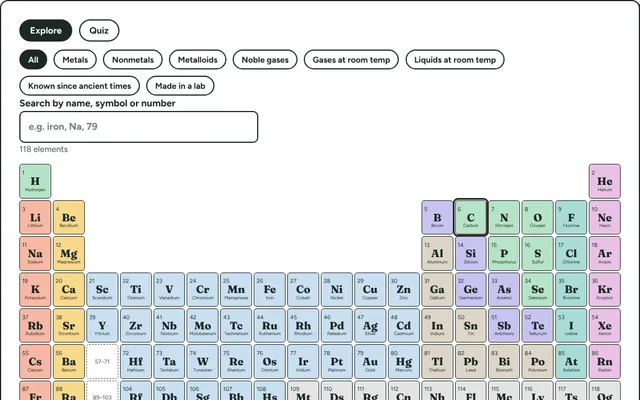
Periodic Table Explorer
All 118 elements, coloured by family. Click one for its atomic number, mass, state, discovery and an everyday use, or highlight metals, gases and more.